What are the markets and investments going to do over the next 12-18 months?
Most financial advisors will respond, “No one can know, so just stay the course.”

At FourThought Private Wealth, we think this is a cop-out.
We agree that no one can see the future, but that doesn’t mean you shouldn’t have a process that allows you to allocate your investments and then adjust those allocations as the facts reveal themselves. Or, as we like to say, “Even though you can’t predict the weather, don’t plan a camping trip when there is a hurricane forecast!”
Last month we shared the process we use to guide our thinking through consequential and rare events or other matters that require forecasting. We call it our “street signs process.” My goal in this post is to update you on our thinking and provide more insight regarding our process.
Awareness of our natural biases is key to avoiding the problems they can create with our investments.
The way most people “predict” is that they gather as much information as they can digest and understand, think about it, then make a judgement. That prediction becomes their projected end point. Then their natural biases kick in. For example, they tend to hunt for information that confirms their predictions and reinforces their judgments (known as recency bias). This leads to bad investment decisions.
Think in terms of probabilities, not predictions.
At FourThought Private Wealth we don’t predict; we forecast. We gather all the information we can digest and understand. But here is where our process diverges. We then we discuss possible outcomes and assign a probability to each outcome based on our judgement. As information becomes available we adjust the probabilities. These probability assignments are then reflected in our portfolio’s asset allocations. Most importantly, they are dynamic.
Think of it like a meteorologist predicting a hurricane. When the storm forms in the Atlantic, the potential paths, or where it might make landfall, are very wide. As the storm moves, the potential landing areas change and get more precise. Likewise, as we have been living with the virus for over two months, the possible outcomes and their impact on investments have become clearer. Predictably, market volatility has reduced.
The virus and the government’s responses to it are not the only factors we consider when thinking about the markets. We also contemplate valuations. With each possible outcome we think about what our national corporate earnings will likely be. Then we project those earnings into possible stock valuations and determine if the risk vs. reward is favorable or unfavorable.
Look at economic recovery as different scenarios on a bell curve.
We introduced the concept of street signs in early March. Like so many exercises in which one is measuring possible outcomes, the analysis of probable economic recovery results disperses along a bell curve. You’ll have a few results that are extremely high and a few that are low. The results with the highest probability of happening will be in the middle of the curve, or at the median.
In early March, the extreme on the negative end or tail of the curve was the prediction of an 18-month shutdown and over one million deaths. On the positive tail, some predicted this would be like a bad flu season. As the virus hit Italy and U.S. caseloads increased, the bell curve started to shift towards a negative outcome. Thus, the likelihood of this being like a bad flu season was reduced to a near zero percent probability.
On the negative side, New York Governor Andrew Cuomo and others were warning of horrible possible outcomes because of the lack of ventilators and overwhelmed health care systems. States started to implement various lock-down measures and the markets were volatile and convulsing.
As the data changes assumptions change, and that changes the probabilities.
Compare the current market against recovery scenarios and extrapolate.
This is where our job gets tricky. We must assign probable valuations to the market (S&P 500) under these various coronavirus/economic scenarios. Then, we compare the current market valuations to our forecast market valuations under each of those scenarios. Looking at the probability of each of these scenarios (remember the bell curve), we compare them with the valuations to make allocation decisions.
For example, in early March the news was bad but not the worst possible. We seemed to be on the “below average outcome road” yet the market was priced as if the worst-case scenario was the base case. In other words, the news was bad but not as catastrophic as market prices were reflecting. This created a valuation to probable outcome mismatch. We got fully invested.
Where are we now and what are we doing?
Obviously we are not epidemiologists, and we certainly did not stay at a Holiday Inn last night (old joke lifted from a TV commercial). But just as we track things like trajectory, barometric pressure and wind speed in a hurricane, we must consider multiple factors when tracking the virus; our street signs.
These are our current street signs:
-
Infection rates and effects of social distancing
-
Progress towards effective therapies
-
Development of a vaccine
-
Testing and contact tracing
-
The Federal reserve’s actions
-
Fiscal policy
We know that these street signs will come in no predictable order. For example, we may have news on a vaccine before we have news on therapies. As we watch for these we must forecast and consider stock valuations.
We further factor in the propensity of extreme events happening during times of social stress. Don’t ever say, “It can’t get any worse.” Take for example the seemingly rational statement that oil will never be priced at $0. Wrong! There is also a chance of a positive “black swan,” where the amount of stimulus propels the economy to even higher levels than before Covid-19.
The graph below attempts to plot out the various “streets” on which we might find ourselves. The rows of indicators show the signs one might expect to see. Then, we assign an approximate earnings level for the S&P 500, which can be translated into approximate values. From there we can judge the risk vs. reward trade-offs.
We use a bell curve overlay to remind you that the probability of extreme results (called the tails) are smaller than the swelling middle of the curve.
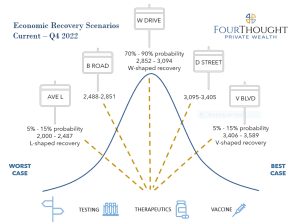
Street #1, “Avenue L” (which could stand for long) is a negative outcome. Here, the street signs show that therapies do not meaningfully save lives or reduce the impact on our health care system. Hot spots, like the one in New York City, simply migrate from city to city. A vaccine is two years out. Contract tracing and testing are less effective than hoped. Finally, we have a second or third “stay at home” order issued in the fall of 2020. On May 4 of this year, a leaked government document modeled 120,000 deaths. The report was discredited but would support this path.
Street # 2, “B Road,” is more probable. The therapeutic Remdesivir, from Gilead, works. However, the second and third expected treatments are ineffective or delayed. A vaccine is still two years away from being available to the masses. Hospitals are not overwhelmed but there is enough of an infection rate that people are self-quarantining. Testing continues to increase gradually but not enough to make consumers confident.
“W Drive” (Street # 3) is our base case and most probable. The therapies continue to become available and greatly reduce the death rate from Covid-19. Think HIV: we don’t have a vaccine, but we have a treatment. Vaccines are still two years away, hospitals are not overwhelmed and our country is open on a limited basis. Some parts of the U.S. are more open that others and individuals are self-quarantining. In this scenario we look a lot like Sweden and the U.S. is operating at about 60 percent of capacity. Restaurants are still losing money and stadiums are empty.
Street # 4, “D Street” is more positive than our base case. The promised therapies work. A vaccine is still two years away. However, people are more comfortable and view Covid-19 as being like a bad flu. There is widespread testing and contact tracing. Most people’s daily lives are inconvenienced but not radically changed. This case’s probability was increased in early May with Pfizer’s announcement that they may have a vaccine in human trials in September.
Street # 5, “V Boulevard,” is as extreme on the positive side as street # 1 is on the negative side. We call it V because of the rapidity of the recovery; we might say the V stands for “victory.” This case is contingent on an early vaccine—one that is available by the end of 2020. The therapies work and individual social distancing has prevented Covid-19 flair-ups. People get back to work full steam and we are looking forward to a normal March Madness basketball tournament. For some businesses, the federal stimulus money is fueling an economic turnaround.
After examining each of these “streets” or outcome scenarios, we assign projected earnings for 2021 and 2022 and place them at the end of each street.
This is admittedly just an educated guess. But we know that last year the S&P earned $150 (the earnings of the weighted average).
So what do you think are rational earnings destinations for each the various streets? (Remember that when earnings go down during a recession, there is a spring-back effect.)
Here is our best guess based on the bell curve and current valuations.
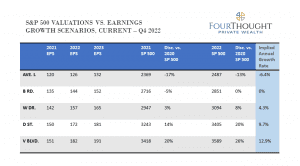
Remember, we are comparing the EPS of the S&P 500 in 2019 to our projected earnings.
The final step is to put valuations on the market and then regress to fair valuations today. For example, the S&P 500 today is priced at 2851. Our base case projects a fair value in two years of 2970. This implies a 4.2% return. So, in our opinion, the market is not cheap based on what we know. But if we end up on the most “optimistic” street, that implies a return more than 14% per annum. Very attractive.
There are admittedly many, many holes one could poke in this approach. Soon we will be passing the first street signs and that will give us hints about what road we are on. We will then recalibrate and redo the work to look at new probable destinations and valuations. Just like your GPS says when you turn into the gas station: “Recalculating.”