One of the most popular philosophers in the modern era was born on May 12, 1925. He served in the United States Navy during the Normandy landings during World War II, a role which earned him a purple heart. He also played professional baseball. His quips about life are now colloquialisms: “When you come to a fork in the road, take it,” and “A nickel ain’t worth a dime anymore.” His name, of course, is Yogi Berra.

Yogi Berra’s wisdom can guide us in thinking about an economic recovery.
At FourThought Private Wealth, our favorite Yogi-ism, especially right now, is “It’s tough to make predictions, especially about the future.”
Can We Rely on Economic Recovery Models?
In these modern times, we are inundated with models making predictions about the future. How often do you turn on the news or read a newspaper and hear about health models, economic models, political models, and climate models? The number of predictions made daily is simply astounding.
The problem with models and algorithms is that they are based on assumptions, and the prototype models are almost always wrong. You simply can’t model the future and predict the outcomes of things yet unseen. The presidential election of 2016 taught us about the fallibility of political models. And if you’ve lived in Florida for a few years you probably know first-hand about the lack of accuracy in hurricane modeling.
Despite this, our society and policy makers rely heavily on models to make predictions and decisions. This is due in large part to human nature. It gives us comfort to think we can understand and model the future.
The Three Letters Everyone is Talking About
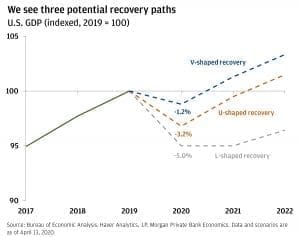
Given the comfort that models can provide, it’s not surprising that models for the recovery of the U.S. and global economies from the COVID-19 crisis are circulating widely. Most have been developed by major investment firms and focus on the “shape” of the recovery and the trajectory of the stock market. Will we have a “V-shaped recovery,” a “U-shaped recovery” or an “L-shaped recovery?” It depends on who you listen to and what you believe about the future.
The V-Shape
In this model V may stand for victory since this recovery model is the most optimistic. The theory is that the economy was solid before the pandemic, and it will return to its previous levels quickly once social distancing measures are removed. It also assumes that the rebound growth would make up for much of the loss in the early part of the crisis.

The chart from JP Morgan Private Bank shows GDP from 2019 projected through 2022 with GDP in 2019 set at 100. It shows three potential options for recovery (L, U, and V) and how each option would impact projected GDP.
The U-Shape
In the U-shaped model recovery happens more gradually. Output does not return to full capacity right away, and the second-half rebound does not make up for the steep decline in the first half of this year. It doesn’t assume that the virus will spread again when restrictions are lifted, but that businesses and people will be nervous and slow to return to “normal,” thus suppressing spending and investment. Restaurants won’t get back to capacity for months, people will remain hesitant to travel, and large gatherings ranging from sporting events to conventions to black tie fundraisers will be temporarily or even permanently altered.
The L-Shape
The opposite of the V-shaped recovery, the L-shaped, could happen if states that begin to open for economic activity see massive spikes in cases, hospitals come under pressure, and the state has to shut down once again.
Forecasting, not Predicting
While one of our central investment tenants is “No Man is a God”—meaning that no one can predict the future—we also think it is crazy to go camping if a hurricane is probable. Therefore, rather than predict, we forecast. We look at indicators that suggest what we should do. If there is a cold front coming through, we layer. If there are clouds on the horizon, we bring an umbrella. However, we understand that the weather may change despite the forecast, and we are ready for sunshine and warmth as well.
Our Recovery Forecast Indicators
Here are some (but not all) of the data points we are watching to forecast the look of a recovery:
- Infection rates
- Opportunities for a cure
- Company earnings
- The number of jobs lost permanently versus those that are furloughed
- The economic activity of states opening up vs. increases in infection rates
As of this publication, our investment committee sees our indicators pointing to a U-shaped recovery. However, we are not married to this analysis, and if additional data challenges this base case we will react accordingly.
For now, we anticipate that we will be trading in bands while the clarity of the data continues to crystalize. This means that we’re looking at ranges within a moving average. The bands help us determine whether prices are relatively high or low.
We’re using the band method because the data we’re seeing suggests neither a dramatic rise or drop in the near term.
When we forecast, rather than predict, we constantly look for data to challenge our assumptions and direction. We don’t have a prediction which we need to defend.
Yogi said it best: “You can observe a lot just by watching.”
