Download Our Latest Whitepaper HERE
COVID-19: Our Yorktown Battle
Think back to the American Revolutionary war and The Battle of Yorktown which proved to be the decisive engagement of the war. The British surrender forecast the end of British rule in the colonies and the birth of a new nation—the United States of America.
Now what??
 So many resources were spent in attaining independence, but now the real battle begins. The period following the Revolutionary War was one of instability and change as our young nation experienced the growing pains of independence and scale. It’s like climbing a mountain, an immense effort is spent trying to reach the next peak, only to find a much larger summit after that.
COVID-19 was our summit to scale or “Yorktown Battle.”
As COVID began we saw record amounts of stimulus packages passed through to businesses and consumers. An enormous amount of monetary stimulus was released into the economy over the last two years which enabled a quick rebound in the market in 2020 and a strong consumer.
This also resulted in inflated asset prices as the stock market traded well above the historical average Price-to-Earnings (P/E) ratio.
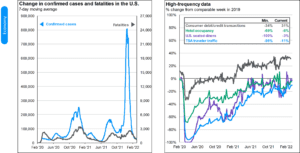
Source: Centers for Disease Control and Prevention, Chase, OpenTable, Our World in Data, STR, Transportation Security Administration (TSA), J.P. Morgan Asset Management. Consumer debit/credit transactions, U.S. seated diners and TSA traveler traffic are 7-day moving averages. Consumer spending: This report uses rigorous security protocols for selected data sourced from Chase credit and debit card transactions to ensure all information is kept confidential and secure. All selected data are highly aggregated and all unique identifiable information—including names, account numbers, addresses, dates of birth and Social Security Numbers—is removed from the data before the report’s author receives it. Guide to the Markets – U.S. Data are as of March 31, 2022.
As you can see, COVID cases have come down to essentially an all-time low since the initial outbreak and high-frequency data is telling us that consumer spending on goods is well above pre-pandemic levels and spending on services (travel, entertainment, etc) has almost fully recovered to pre-pandemic levels as well.
Navigating Through The Fog
Our economy is throwing off both positive and negative signs. If we look out the negative window, we see the Federal Reserve raising interest rates and reversing quantitative easing.
We see supply chains that are disrupted and shortages of natural resources. We see an unexpected war in the Ukraine pushing oil prices higher. If we look out the positive window, we see an economy that is recovering. The consumer is in great shape with low debt, low unemployment, and rising wages.

This is like driving your car on a highway and expecting fog. When the fog hits you shouldn’t slam on your brakes nor drive recklessly. You should slow down and be prepared for possible hazards. Likewise, we are taking steps to raise cash and to migrate portfolios toward companies that are undervalued and are expected to perform well in a rising inflation environment.
Four Street Signs to Watch For In The Fog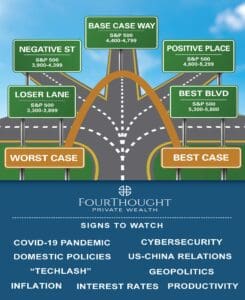
After a few strong years of market performance, we have been left with a choppy market in the first quarter and a lot of uncertainty heading into an important earnings season.
We need to pay attention to the street signs and navigate safely through the foggy drive ahead.
1. Inflation
Inflation remains red-hot as Headline CPI reached 7.9% year over year as of February 2022 driven by both transitory factors such as food, energy, and new/used cars as well as sticky inflationary pressures such as shelter, household goods, and cost of services.
We see both Cost-Push and Demand-Pull inflationary pressures in the current market.
Cost-Push inflationary pressures are more so driven by supply-chain bottlenecks.
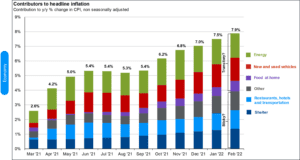
Source: BLS, J.P. Morgan Asset Management. Contributions mirror the BLS methodology on Table 7 of the CPI report. Values may not sum to headline CPI figures due to rounding and underlying calculations. “Shelter” includes owners equivalent rent and rent of primary residence. “Other” primarily reflects household furnishings, apparel and medical care services. Guide to the Markets – U.S. Data are as of March 31, 2022.
Cost Push Inflation:
Oil markets are a textbook example of this as the number of active rigs decreased by about 75% in 2019 through the middle of 2020. Now that demand has returned, there is a shortfall of supply which is driving prices higher.
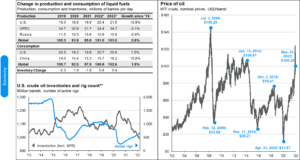
Source: J.P. Morgan Asset Management; (Top and bottom left) EIA; (Right) FactSet; (Bottom left) Baker Hughes. *Forecasts are from the March 2022 EIA Short-Term Energy Outlook and start in 2022. **U.S. crude oil inventories include the Strategic Petroleum Reserve (SPR). Active rig count includes both natural gas and oil rigs. WTI crude prices are continuous contract NYM prices in USD. Guide to the Markets – U.S. Data are as of March 31, 2022.
The same can be said for new and used cars where supply-chain disruptions have been even more pronounced, and car lots have little to no inventory.
Demand Pull Inflation:
We see more Demand-Pull inflationary pressure in the market from COVID-related stimulus whereby we saw new excess savings skyrocket in 2020 and 2021, followed by increased spending. There were more dollars in the system chasing the same amount of goods, which pulled prices upwards.
We are also seeing this effect in the travel industry whereby airplanes and hotels are now able to attract higher prices per consumer as demand has returned.
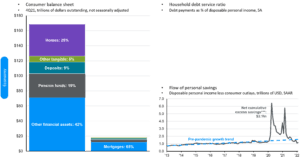
Sour Data include households and nonprofit organizations. SA – seasonally adjusted. SAAR – seasonally adjusted annual rate. *Revolving includes credit cards. Values may not sum to 100% due to rounding. **1Q22 figures for debt service ratio are J.P. Morgan Asset Management estimates. ***Net cumulative excess savings are calculated by summing the difference in realized savings and pre-pandemic trend savings from March 2020 to February 2022 and dividing by 12. Guide to the Markets – U.S. Data are as of March 31, 2022. e: FactSet, FRB, J.P. Morgan Asset Management; (Top and bottom right) BEA.
The issue with inflation as it currently stands is that a great portion of the inflation we are seeing today is being driven by supply-chain shortages, which will not necessarily be relieved by quantitative tightening.
It will be interesting to see how the Fed chooses to navigate these waters in order to keep employment high and the economy stable while attacking inflation.
2. Quantitative Tightening
The Fed will attempt to battle inflation through aggressive quantitative tightening by both increasing interest rates and reducing the Federal Balance Sheet. The Fed now expects to raise rates to about 2% by the end of the year and 2.4% as a long-run projection. ²
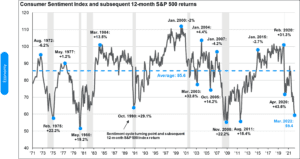
Source: BLS, FactSet, Federal Reserve, J.P. Morgan Asset Management. Guide to the MaReal 10-year Treasury yields are calculated as the daily Treasury yield less year-over-year core CPI inflation for that month. For the current month, we use the prior month’s core CPI figures until the latest data is available. Guide to Markets – U.S. Data are as of March 31, 2022.
Investors have seen a quick spike to the short-term rates and slight inversion in the curve at select maturities, which is not a sign of a healthy markets.
However, that did not last long and over the last couple of weeks we have seen the spread in the 2y/10y increase
3. Economic Growth and Productivity
Economic Growth is back to its pre-Covid trendline of ~ 2.0% growth.
Real GDP growth is expected to be 2.8% in 2022 as per the latest Fed projections which would put the GDP growth above trendline to end the year.
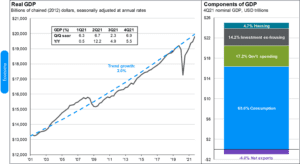
Source: BEA, FactSet, J.P. Morgan Asset Management. Values may not sum to 100% due to rounding. Trend growth is measured as the average annual growth rate from business cycle peak 1Q01 to business cycle peak 4Q19. Guide to the Markets – U.S. Data are as of March 31, 2022.
Wages and Unemployment have also impressed, with unemployment at 3.6% which is almost back to pre-covid levels of 3.5% (the lowest level the market has seen for the last 50 years).
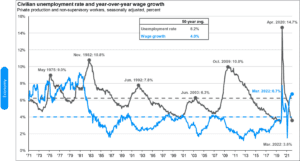
Source: BLS, FactSet, J.P. Morgan Asset Management. Guide to the Markets – U.S. Data are as of March 31, 2022.
Wage growth was 6.7% as of March 2022, well above the 50-yr average 4.0% growth, yet real wage growth is negative due to heightened inflation.
4. The Stock Market
Growth stocks do not like when interest rates rise as they are valued on future expected cash flows typically at higher multiples than value stocks.
An increase in interest rates could impact future cash flow growth as the company might have to raise debt at higher rates. Higher interest rates also increases the discount rate for the company used in valuation, which has an inverse effect on intrinsic value.
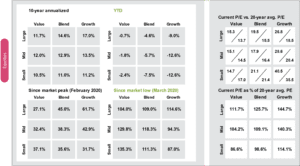
Source: FactSet, Refinitiv Datastream, Russell Investment Group, Standard & Poor’s, J.P.Morgan Asset Management. All calculations are cumulative total return, including dividends reinvested for the stated period. Since Market Peak represents period from 2/19/20 to March 31, 2022. Since Market Low represents period from 3/23/20 to March 31, 2022. Returns are cumulative returns, not annualized. For all time periods, total return is based on Russell style indices with the exception of the large blend category, which is based on the S&P 500 Index. Past performance is not indicative of future returns. The price-to-earnings is a bottom-up calculation based on the most recent index price, divided by consensus estimates for earnings in the next 12 months (NTM) and is provided by FactSet Market Aggregates and J.P. Morgan Asset Management. Guide to the Markets – U.S. Data are as of March 31, 2022.
We have seen growth stocks experience multiple compression which has been more pronounced in Small and Mid-cap companies.
Corporate earnings have been strong this year increasing 4.1%, meaning that since the market is down 5% YTD as of 3/31/22, multiple growth has been about -9%.
Valuations have come down to 19.46x from their high of about 23x in 2021. While this is a more reasonable P/E multiple, it is still above the 25-yr average of ~ 17x.
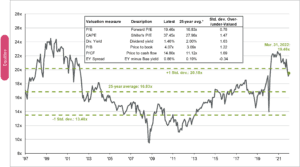
Source: FactSet, FRB, Refinitiv Datastream, Robert Shiller, Standard & Poor’s, Thomson Reuters, J.P. Morgan Asset Management. Price-to-earnings is price divided by consensus analyst estimates of earnings per share for the next 12 months as provided by IBES since March 1997 and by FactSet since January 2022. Current next 12-months consensus earnings estimates are $233. Average P/E and standard deviations are calculated using 25 years of history. Shiller’s P/E uses trailing 10-years of inflation-adjusted earnings as reported by companies. Dividend yield is calculated as the next 12-months consensus dividend divided by most recent price. Price-to-book ratio is the price divided by book value per share. Price-to-cash flow is price divided by NTM cash flow. EY minus Baa yield is the forward earnings yield (consensus analyst estimates of EPS over the next 12 months divided by price) minus the Moody’s Baa seasoned corporate bond yield. Std. dev. over-/under-valued is calculated using the average and standard deviation over 25 years for each measure. *P/CF is a 20-year average due to cash flow availability. Guide to the Markets – U.S. Data are as of March 31, 2022.
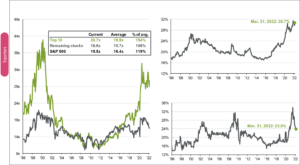
Source: FactSet, Standard & Poor’s, J.P. Morgan Asset Management. The top 10 S&P 500 companies are based on the 10 largest index constituents at the beginning of each month. The weight of each of these companies is revised monthly. As of 3/31/2022, the top 10 companies in the index were AAPL (7.1%), MSFT (6.0%), AMZN (3.7%), TSLA (2.4%), GOOGL (2.2%), GOOG (2.0%), NVDA (1.8%), BRK.B (1.7%), FB (1.3%), UNH (1.3%) and JNJ (1.2%). The remaining stocks represent the rest of the 494 companies in the S&P 500. Guide to the Markets – U.S. Data are as of March 31, 2022.
The top 10 companies in the S&P500 are driving the high P/E multiple as the cohort has an average P/E of 30.7x versus the remaining 490 stocks at 16.6x.
As of 3/31/22, the top 10 companies in the S&P500 make up about 31% of the weight in the index.
Driving Through The Fog – Our Plan
1. Slow Down Around The Curves
When there is a lot of uncertainty in the equity markets it’s important to slow down and focus on the cash flow that companies pay off on a regular basis in dividends. As we always say, don’t kill the goose that lays the golden eggs.
We build our portfolios with a focus on high quality cash flow growth that will sustain temporary headwinds and higher interest rates.

We are taking this time to selectively buy more of these great companies that are high-quality cash flow generators trading at large discounts to fair value. Fear in the markets provides buying opportunities for high quality companies.
2. Fill Up All The Tires
Just like a car, investors want their portfolios to have a balance across different asset classes. Diversification is extremely important here as many defensive industries have outpaced growth in Q1.
We continue to favor Energy, Materials, and other sectors that have been out of favor in the last 2-3 years. Stay nimble and don’t take big bets on any one individual company. Also be weary on the concentration risk of the market-cap-weighted indices such as the S&P500 where big companies receive the biggest share of the index.
3. Listen to the GPS!
When you are driving down the road and your GPS updates your route, follow it!
Private investments are a space we favor currently as a diversifying asset that can provide cash flow and relatively stable pricing even when the public markets are going through turbulent periods. We have built up a cash-reserve in our model portfolios as ‘dry powder’ for continued market volatility. Look for us to sit on an elevated cash position until we find attractive investment opportunities in high-quality companies.
FROM THE DESK OF:

Scott Pinkerton, CFP®, CIMA®, CPWA® | Partner, Planner

CONTRIBUTING AUTHOR: Jake MacFarlane| Research Analyst
Sources:
1. JPM Guide to the market (all charts)
2. Federal Reserve March Meeting Minutes (https://www.federalreserve.gov/monetarypolicy/files/monetary20220316a1.pdf)
3. U.S. Bureau of Labor Statistics (https://www.bls.gov/)
