Download Our Latest Whitepaper HERE
If you recall from our Fourth Quarter Economic review, our topic was Stay on Target. At the end of the newsletter we stated, “Targets can shift or be moved” and “we need to know how to separate the news from the noise.”
As we have seen from rising inflation during the second half of 2021, the theme of stay on target remains true. It is important to research the drivers of the increase in inflation, what has been impacted, and what the future may hold.
We have all seen the news headlines stating that this new hyper-inflation is the highest it has been in over three decades and people were eating Thanksgiving meals from a can this year.
While they are not completely wrong, we must digest this news, determine how bad it really is and assess what can be done.
When reviewing the data provided by the Bureau of Labor Statistics, it is clear inflation has been rapidly increasing and it is high. It is also important to see what inflation rates have been at in prior years.
We cannot predict the future, but we can generate a plan that will reduce the casualties of certain events. Having a plan makes unforeseen market and economic events more tolerable.
INFLATION
Inflation has caused many of us to worry about the rising prices of goods and services. The Consumer Price Index, or CPI, is a measurement used to track inflation provided by The Bureau of Labor Statistics.
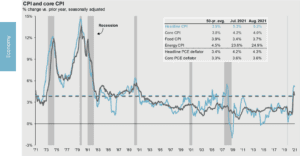
Source: BLS, FactSet, J.P. Morgan Asset Management. CPI used is CPI-U and values shown are % change vs. one year ago. Core CPI is defined as CPI excluding food and energy prices. The Personal Consumption Expenditure (PCE) deflator employs an evolving chain-weighted basket of consumer expenditures instead of the fixed-weight basket used in CPI calculations. Guide to the Markets – U.S. Data are as of September 30, 2021.
We have all seen our grocery bills go up, gas prices soar, and the news headlines about hyper-inflation. It is important to take a step back and look at what is driving this.
From this chart on the left we can see the history of inflation and on average we should be around 2% a year. From 2013 – 2019 we averaged 1.8%. The low rates from these years have made the spike in inflation seem dramatic in comparison.
This chart below illustrates recent core CPI in the last two years compared to our baseline of 2%. Core CPI is the same basket of goods that makes up CPI but takes out food and energy.
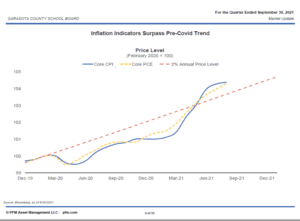
Source: Bloomberg as of 9/30/2021
It was below 2% for the first year of the pandemic and is now above 2%.
INTEREST RATES & CONSUMER SENTIMENT
Interest rates will be important to watch. As inflation increases, it is a widespread practice for the Federal Reserve to raise rates to try and slow spending and lending which is a driver of inflation. Here we see rates are higher but not dramatically so.
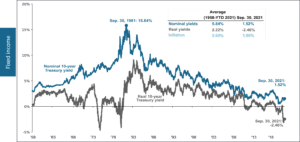
Source: BLS, FactSet, Federal Reserve, J.P. Morgan Asset Management. Real 10-year Treasury yields are calculated as the daily Treasury yield less year-over-year core CPI inflation for that month except for September and August 2021 where real yields are calculated by subtracting out September 2021 year-over-year core inflation. Guide to the Markets – U.S. Data are as of September 30, 2021.

Source http://www.sca.isr.umich.edu/files/chicsr.pdf
Consumer sentiment has started to decline in the last month.
Our research indicates this is due to Americans lacking confidence in our ability to implement policies to reduce inflation.
While sentiment is declining, spending remains strong. This is unusual. Typically, consumers react by reducing spending.
SUPPLY CHAIN
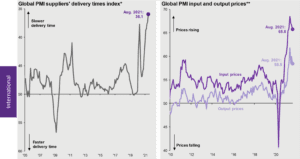
Source: IHS Markit, J.P. Morgan Asset Management. *Participants in IHS Markit’s PMI business surveys, conducted in 44 countries, are asked: “Are your suppliers’ delivery times slower, faster or unchanged on average than one month ago?“. Index includes the manufacturing and construction sectors. A reading of 50 = no change, >50 = faster delivery time, <50 = slower delivery time.**Participants are asked: “Are input/output prices the same, higher or lower?”. Values shown reflect the composite index which includes both manufacturing and services. A reading of 50 = no change, >50 = price increase, <50= price decrease. Guide to the Markets – U.S. Data are as of September 30, 2021.
Supply chains have also been at the top of headlines. The bottlenecks from imports have caused headaches for companies and consumers. These issues have had a direct impact on inflation and the increase in prices.
For example, the cost of renting a shipping container has risen from $4500 a container in September 2020 to over $25,000 as of September 2021.
However, there does appear to be a light at the end of the tunnel. Auto manufactures who had to cut production due to semiconductor chip shortages, have reported factories and production lines are back to full operation. The backlog of container ships waiting outside the ports also declined more than 50% during October and November.
The Baltic Exchange Dry Index, which is a leading indicator for inflation and measures the cost of shipping materials, has declined since peaking October 7, 2021.
UNEMPLOYMENT AND LABOR DEMAND
We continue to see record job openings and strong demand for labor. Unemployment levels have also declined significantly since the height of the pandemic.
This implies that inflation will decrease in the near future.
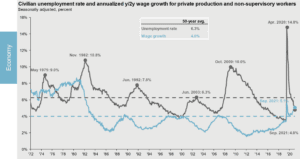
Source: BLS, FactSet, J.P. Morgan Asset Management. Guide to the Markets – U.S. Data are as of October 31, 2021
As labor and wages increase, we hope to see productivity increase which would be a win-win for the consumer and the producer.
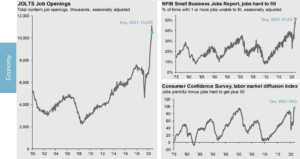
Source: Conference Board, National Federation of Independent Business, U.S. Department of Labor, J.P. Morgan Asset Management. The diffusion index is calculated as the percentage of consumers reporting jobs plentiful minus those reporting jobs hard to get plus 50. Guide to the Markets – U.S. Data are as of October 31, 2021.
ECONOMIC ACTIVITY
Economic activity continues to increase. Travel, hotel occupancy, and spending is increasing and moving closer to pre-pandemic levels.
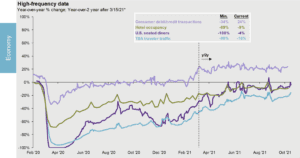
Source: Chase, OpenTable, STR, Transportation Security Administration (TSA), J.P. Morgan Asset Management. *Beginning 3/15/2021, all indicators compare 2021 to 2019. Prior to 3/15/2021, figures are year-over-year. Consumer debit/credit transactions, U.S. seated diners and TSA traveler traffic are 7-day moving averages. Consumer spending: This report uses rigorous security protocols for selected data sourced from Chase credit and debit card transactions to ensure all information is kept confidential and secure. All selected data is highly aggregated and all unique identifiable information—including names, account numbers, addresses, dates of birth and Social Security Numbers—is removed from the data before the report’s author receives it. Guide to the Markets – U.S. Data are as of October 31, 2021.
This demand has been a factor in higher prices of airline tickets and average hotel room prices.
This demand is increasing prices.
HOUSEHOLD NET WORTH
Household net worth has been increasing steadily since the financial crisis of 2008-2009. It continued to increase even during the pandemic. Household debt has declined sharply over this same time.
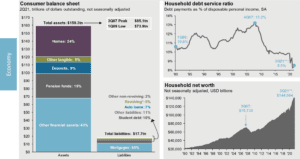
Source: Alliance Bernstein, Capital Markets Outlook, 4th Quarter 2021
This debt service ratio is an indicator that even through an increase in inflation, most Americans are positioned to afford the increase in prices of goods and services, and we are starting to see credit card debt increase as of late.
It is also a key reason Americans are leaving the work force…because they can!
THE DOLLAR, RATES, AND STOCKS

Source: J.P. Morgan Asset Management; (Left) FactSet, ICE; (Top right) Bureau of Economic Analysis, FactSet; (Bottom right) Tullett Prebon. Currencies in the DXY Index are: British pound, Canadian dollar, Guieuro, Japanese yen, Swedish krona and Swiss franc. *Interest rate differential is the difference between the 10-year U.S. Treasury yield and a basket of the 10-year yields of each major trading partner (Australia, Canada, Europe, Japan, Sweden, Switzerland and UK). Weights on the basket are calculated using the 10-year average of total government bonds outstanding in each region. Europe is defined as the 19 countries in the euro area. de to the Markets – U.S. Data are as of October 31, 2021.
The US dollar remains strong and will lead foreign countries to continue buying US debt and invest in US companies’ long term. This will offer a counterbalance to rising rates and will be a positive influence on the real estate and stock markets.
The first week of December was an important one. The Fed announced that they will “accelerate the taper” and they are likely to have two rate increases in 2022 instead of one. Yields on the 10-year Treasury declined, and the stock market suffered four straight weeks of declines.
This has caused growth stocks to correct. This is a necessary and expected correction. We are incredibly careful not to make substantial portfolio changes at the end of the year for tax reasons
However, our Investment Committee is watching our Christmas list of great companies whose prices are too high (in our opinion) but are getting closer to reasonable buy ranges.
Our base case is that the Fed and the natural economic forces will allow inflation to drift to more normal rates but not “get out of control.” We are sticking with our long-term strategic allocations and using corrections to rebalance portfolios.
CORPORATE EARNINGS AND GDP
Corporations are seeing strong earnings reports and employees are seeing benefits as well. These are all indicators of a healthy economy with continuous growth.
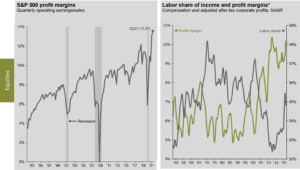
Source: BEA, Compustat, FactSet, Standard & Poor’s, J.P. Morgan Asset Management. Past performance is not indicative of future returns. *Labor share of income and profit margins are shown on a 4-quarter moving average basis. Guide to the Markets – U.S. Data are as of September 30, 2021
GDP has risen from pandemic lows and are close to pre-pandemic levels. We will have to see how the Covid variants affect travel and leisure companies and their growth and outlook.
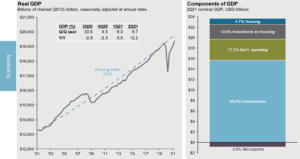
Source: BEA, FactSet, J.P. Morgan Asset Management. Values may not sum to 100% due to rounding. Trend growth is measured as the average annual growth rate from business cycle peak 1Q01 to business cycle peak 4Q19. Guide to the Markets – U.S. Data are as of September 30, 2021
FROM THE DESK OF

ALEXANDER WOLFE, CFP®, Associate Planner
CONTRIBUTING AUTHOR:

SCOTT PINKERTON, CFP®, CIMA®, CPWA®, Partner, Planner
IMPORTANT DISCLSOURES:
FourThought Financial, LLC (FFLLC) is an SEC-registered investment advisor. For information pertaining to FFLLC please contact FourThought Private Wealth or refer to the SEC’s website, www.adviserinfo.sec.gov. This presentation is provided for informational purposes, not as personal investment advice. This presentation may contain certain forward-looking statements which indicate future possibilities. Any hypothetical example is intended for illustrative purposes only and does not represent an actual client or an actual client’s experience, but rather is meant to provide an example of the process and the methodology. Any reference to a market index is included for illustrative purposes. It should not be assumed that your account performance will correspond directly to any benchmark index. There is no guarantee views and opinions expressed herein will come to pass. Past performance is no guarantee of future results.