Potential Effects on Your Portfolio and Psyche
People are worried right now. They are worried about Covid-19, worried about civil unrest, worried about educating their children and worried that they will never be able to resume life as it once was. At the top of the list of their worries is money. According to a recent CNBC poll, more than one-third of likely voters have a dismal view of their finances — and a bleak outlook for employment, wages, job security and health care.
Those who are invested are particularly worried about the outcome—or lack thereof—of the presidential election, which is widely expected to be contested. Even if that doesn’t happen, they are worried about the economy under a candidate for whom they did not vote. This is reflected in the Volatility Index, or Vix: a measure of volatility in the U.S. stock market. Futures tied to the Vix have long reflected investor concerns about future turmoil, and Vix futures contracts maturing in October and November have been climbing.
Nervous investors may feel compelled to move their money into cash or get out of the markets altogether, while bolder investors may be betting on volatility and taking excessive risks. However, history suggests that neither of these are wise strategies.
While the next presidential election may even put investors with nerves of steel to the test, here are three reasons to stay fully invested through the election, even if it is contested.
1. Election contestations can result in market volatility, but it has historically been a temporary situation and that is the expectation in this election.
Long-lasting and extreme volatility in the markets have typically resulted not from presidential elections, but economic shock. This holds true even when there is an unresolved dispute about the outcome, like there was in the 2000 election between Bush and Gore.
Even though the 2000 election was undecided for more than a month, in retrospect the election is not viewed as the cause of the corresponding market decline—rather, it was attributed an unfolding bear market that began eight months earlier and would not bottom until late 2002. Jessica Rabe, co-founder of DataTrek Research, noted that the S&P 500 slipped 4.2% in the five weeks from the election day until the Supreme Court ruled Bush the winner. Yet it came shortly after an already pressured Nasdaq absorbed major earnings warnings from several large tech firms.
Dr. David Kelly, a noted economist and the Chief Global Strategist for JP Morgan noted his group does not believe investors should delay appropriate investments until after the election. “After all,” he wrote in a recent opinion piece for JPM, “almost all elections end up reducing political uncertainty rather than increasing it, and stocks tend to fare better when uncertainty falls. However, this is a good time to check portfolios to ensure that they are sufficiently diversified to weather extended election turmoil should it unfold, but also positioned to benefit from a global recovery from the pandemic in 2021 and beyond.”
For its part, Goldman Sachs last week noted, “The markets’ expected one-day move on Nov. 4 [day after Election Day] has fallen from 3.2% in mid-August to 2.8% now, as investors assess the potential for it to take longer than usual to reach definitive election results.”
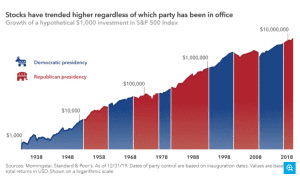
2. The U.S. stock market has trended up for nearly 90 years, regardless of whether there was a Democrat or Republican in office.
If Joe Biden wins the presidency, will it spell doom for the markets? While campaigning he has proposed a host of policy changes that many view as big government and anti-business, from raising corporate tax rates to capping deductions, increasing stimulus payments and more.
Conventional wisdom would suggest that these types of policies, should they come to pass, will have a deleterious effect on U.S. markets. However, nearly 90 years of market history under both Democrats and Republican presidents, in a variety of economic conditions, have shown that presidents’ political parties have little impact on market movements. That stands to reason, but what about the actions that presidents take? 
Recently, the people at Forbes set out to understand the relationship between the actions of a president and the direction of stocks when they analyzed stock market performances, including dividends, dating back to Harry Truman. Using data from the National Bureau of Economic Research (NBER), they looked at the number of expansions and recessions that began during the tenure of each president. Credit was awarded to the president who was in office during the inception of expansions and recessions, not who held office the longest under various economic scenarios.
Under which president did markets do best? Democrat William J. Clinton, with nearly 210%. The worst was under George W. Bush, with -40%.
As the study authors pointed out, uncertainty is historically the biggest disrupter of markets, good or bad—not presidents. In September 1955, for example, stocks plunged 6.5% in a single day when Eisenhower suffered a sudden heart attack after a golf outing. When Kennedy was assassinated in November 1963 the immediate fall off was 3%. In both instances stocks promptly recovered.
The major takeaway is that investors can take comfort in the fact that in the long run, buy and hold worked best. As the chart from Capital Group shows below, if an investor made a $1,000 investment in the S&P 500 Index when Franklin D. Roosevelt was president, it would have grown—under seven Democrat and seven Republican presidents—to $14 million by 2018.
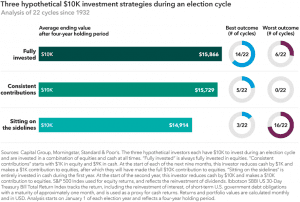
3. Staying fully invested over a four-year period resulted in higher values than sitting on the sidelines over the past 22 election cycles.
In the hypothetical example below from Capital Group, three investors take different approaches to investing during election cycles (22 cycles were analyzed). While the investor who stayed fully invested had the best average ending value and number of positive outcomes the investor who made consistent contributions also did well. However, the investor who sat out during the election had the worst outcome 16 times and a lower average return.
It is true that past results are no prediction of the future, and we are living in a time when a contentious election is not the only issue affecting markets and the economy (something of an understatement). However, we at FourThought posit that the time-honored principle of staying invested for the long-term—which means staying fully invested through and long after the November presidential election—will ultimately be better for investors than pulling out or moving everything to cash.
FourThought Private Wealth is owned by FourThought Financial, LLC (FFLLC) is an SEC-registered investment advisor. For information pertaining to FFLLC please contact FourThought Private Wealth or refer to the SEC’s website,www.adviserinfo.sec.gov. This presentation is provided for informational purposes, not as personal investment advice. This presentation may contain certain forward-looking statements which indicate future possibilities. Any hypothetical example is intended for illustrative purposes only and does not represent an actual client or an actual client’s experience, but rather is meant to provide an example of the process and the methodology. Any reference to a market index is included for illustrative purposes. It should not be assumed that your account performance will correspond directly to any benchmark index. There is no guarantee views and opinions expressed herein will come to pass. Past performance is no guarantee of future results.
