Disco Inferno – Inflation Hot!
Are We Going Back to the 70’s?
(To download a printable pdf of this white paper, click HERE).
Back in the 70’s
The last time the USA had crippling inflation was in the late 1970s when Managing Partner and Co-Chief Investment Officer, Scott Pinkerton was in middle and high school.
 Scott remembers a fall day when he and his brother were in the “Venice Sun Fiesta” parade driving a go-cart adorned with a big white circle surrounding the word WIN on it. WIN stood for “Whip Inflation Now.”
They passed their WIN buttons out to parade watchers hoping for candy , but their efforts had about the same effect as the Nixon/Ford and Carter administration’s efforts to control inflation through price controls.
Inflation is classically defined as having too much money chasing too few goods.¹ There are two types of inflation: cost-push and demand-pull.
It not only feels like inflation today, but statistics are also reading “inflation hot.”
Cost-push happens when the cost of producing goods and services (commodity costs and wages for example) goes up and pushes prices higher.
Demand-pull is when you artificially increase the money in people’s pockets (deficit spending), thus creating more dollars chasing the same amount of goods and services and pulling prices higher. Right now, we have both.

Fractured supply chains are limiting our economy’s ability to fire back up and employers are having to increase wages to entice people to return to work (cost-push).
In addition, our government has aggressively pushed money into the economy through low interest rates, bond issuance support, and direct payments to Americans (demand-pull).
Fed Chair J Powell is confident that these inflationary pressures are a temporary phenomenon and that long term disinflationary pressures will win the day ² Others are not so sure.
OUR FOURCAST…..Our long-term readers know that we “Fourcast,” not predict.
Predicting is analyzing the data, developing a narrative to explain the data and then extrapolating an outcome based on that narr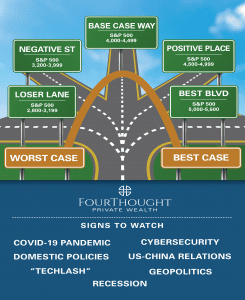 ative.
“Fourcasting” is thinking deeply about the many unique variables that come into play and assigning probabilities to each outcome.
From there you must continually reassess the various data points, determine if there are new data points to consider, and adjust the probabilities accordingly. This requires discipline and additional work, but it avoids the predictor’s biases that can be deadly to your financial health.
We developed a visual tool called street signs to help our clients understand our process. Forecasting is like riding in a car where you have no control over the destination. The best you can do is to look out the window and observe the street signs and landmarks. As you see more signs and landmarks, you have a better idea of your final destination.
At the beginning of the year, we updated our street signs to include the following signs: cyber security, geopolitical conflicts, recession, ‘tech lash” (or regulation risk), government policies (both fiscal and monetary) and US China relations.
1. VACCINE SHAPED, POLICY FUELED
 At the beginning of 2021, the biggest variable facing the world was Covid-19 but now vaccines are turning the tide. They have proven to be mostly effective, are widely available, and resulted in a steady decline of U.S. cases for several months. The expectation is that this will eventually bring us closer to herd immunity and back to normal.
It is widely believed that herd immunity is then followed by herd mentality to get back out, travel, enjoy restaurants and spend money. With the recent onset of the Delta Variant and rise in cases, only time will tell.

Source: As of April 5, 2021. “GDP” refers to domestic gross product. The economic and market forecasts presented herein are for informational purposes as of the date of this document. There can be no assurance that the forecasts will be achieved. Past performance does not guarantee future results, which may vary.
The Fed has said that it will start to taper bond purchases in 2023. ³ The translation: The Fed, through quantitative easing, has been purchasing $120 billion worth of bonds monthly. This has the effect of keeping interest rates lower than they would naturally be. They will gradually reduce bond purchases in 2022.
This Growth Drivers graph represents what we believe to be the most likely economic scenario. The GDP growth will slow but still be above the long term average. We see the risk of recession as very low.
2. INFLATION
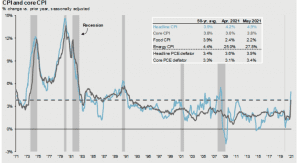
Source: BLS FactSet: JP Morgan Asset Management CPI used is CPI-U and values shown here are % change vs. one year ago. Core CPI is defined as CPI excluding food and energy prices. The Personal Consumption Expenditure (PCE) deflator employs an evolving chain-weighted basket of consumer expenditures instead of the fixed-weight basket used in CPI calculations. Guide to the Markets – U.S. Data are as of June 30, 2021
Inflation is another story. The graph to the right, courtesy of J.P. Morgan Asset Management, shows long term inflation trends. The far right of the graph shows a huge jump in inflation. Note that the measurement is a year-over-year comparison.
Oil, for example, famously went below $0 a barrel around 12 months ago. Nevertheless, there is a lot of inflation. This is expected but not necessarily permanent.
Inflation is one thing, but it is inflation expectations that drive the markets….
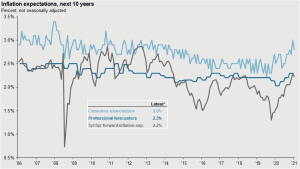
Source: FactSet, Federal Reserve Bank of Philadelphia, Federal Reserve Bank of St. Louis, University of Michigan, J.P. Morgan Asset Management. *Data show the latest flash or final reading from the University of Michigan Survey of Consumers, latest daily 5yr/5yr forward inflation expectation rate, and the latest quarterly Survey of Professional Forecasters on a 1-month lag. The University of Michigan Survey of Consumer asks consumers, “By about what percent per year do you expect prices to go (up/down) on the average, during the next 5 to 10 years?”. The Survey of Professional Forecasters is conducted by the Federal Reserve Bank of Philadelphia and reflects the median estimate by professional forecasters of average CPI inflation over the next 10 years. The 5-year, 5-year forward inflation expectation rate measures the expected inflation rate (on average) over the five-year period that begins five years from today. Guide to the Markets – U.S. Data are as of June 30, 2021.
The 5-year forward expectations are what the market is pricing inflation to be. You will notice in this graph that the market and professional forecasters have increased their inflation expectations but are still well below 2.5 %.
However, The University of Michigan’s consumer forecast shows that people on the street expect a higher level of inflation.⁴ Is the street wrong?
3. UNEMPLOYMENT
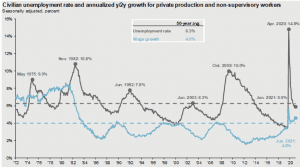
Source: BLS FactSet. JP Morgan Asset Management Guide to the Markets – U.S. Data are as of June 30, 2021
Stagflation was the economic disease of the ‘70s. We experienced something economists of the time did not think we could: high inflation and high unemployment.
We note that we have still have high unemployment which is below its 25-year average but is up about 80% from the pre-pandemic lows.
At the same time, we have a spike in vacant jobs and an uptick in confidence that jobs are readily available.
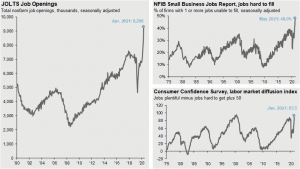
Source: Conference Board, National Federation of Independent Business, U.S. Department of Labor, J.P. Morgan Asset Management. The diffusion index is calculated as the percentage of consumers reporting jobs plentiful minus those reporting jobs hard to get plus 50. Guide to the Markets – U.S. Data are as of June 30, 2021
Many speculate that as increased government unemployment checks sunset, we will see more of these jobs filled. We will just have to wait and see…
4. THAT MONSTER DEFICIT
As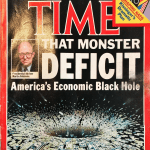 the Time Magazine issue from March of 1984 demonstrates, there has long been concerns about Government deficit.
The graph (2021 Federal Budget) shows that the problem is getting worse.
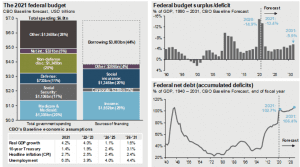
Source: CBO, J.P. Morgan Asset Management (Top and bottom right) BEA, Treasury Department. Estimates are based on the Congressional Budget Office (CBO) July 2021. Update to the Budget and Economic Outlook. Details on the breakdown of spending, excluding net interest, are J.P. Morgan Asset Management estimates. Other spending includes, but is not limited to health insurance subsidies, income security, and federal civilian and military retirement. Note: Years shown are fiscal years. Forecasts are not a reliable indicator of future performance. Forecasts, projections, and other forward-looking statements are based upon current beliefs and expectations. They are for illustrative purposes only and serve as an indication of what may occur. Given the inherent uncertainties and risks associated with forecasts, projections and other forward statements, actual events, results, or performance may differ materially from those reflected or contemplated. Guide to the Markets – U.S. Data are as of June 30, 2021.
We must borrow $3 Trillion annually just to pay our bills. This is before the approval of the bipartisan infrastructure deal ($600 Billion) and the proposed Democratic $3.5 Trillion “American Families Plan.” If passed, what will be the economic impact of another $4.1 Trillion in spending which is more than Germany’s entire GDP.
First, the government will have to borrow money to finance the spending.
We think the supply of bonds will increase while demand will decrease (remember the Fed tapering). This will result in higher interest rates.
An impact of higher corporate taxes will be lower profits. This will lower earnings and ultimately effect stock prices.
5. WHAT GIVES?
What is interesting about the market’s valuations is that the market, as measured by the S&P 500, is up around 14.4% through July 30, 2021, and yet the P/E ratio has actually gone down.
This means the market is actually cheaper now than it was before the run up. So, what gives?
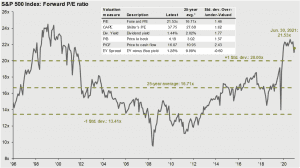
Positive earnings create a virtuous cycle of increasing dividends and stock prices.

Source: FactSet, Compustat, Standard & Poor’s, J.P. Morgan Asset Management Historical EPS levels are based on annual operating earnings per share. Earnings estimates are based on estimates from Standard & Poor’s and FactSet Market Aggregates. Past performance is not indicative of future returns. Guide to the Markets – U.S. Data are as of June 30, 2021
You will note from this chart that earnings grew 19.7% while the market grew only 14.4% therefore allowing the market to get cheaper on a valuation (P/E) basis. Goldilocks⁵ indeed!
6. INTERNATIONAL ECONOMIES GROWTH

Source: FactSet, MSCI, Standard & Poor’s, J.P. Morgan Asset Management. Guide to the Markets – U.S. Data are as of June 30, 2021.
Not all stocks, or markets are created equal.
International stocks are cheaper relative to US stocks than they have been in 20 years; substantially cheaper.
There are great companies with strong, consistent earnings that are trading at valuations substantially below their US counterparts and many offer higher dividends.
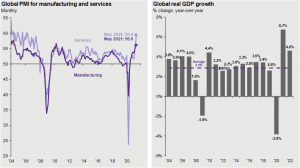
Source: J.P. Morgan Asset Management; (Left) Markit; (Right) J.P. Morgan Global Economic Research. PMI is the Purchasing Managers’ Index. Global GDP growth is a GDP-weighted measure of real GDP at U.S. dollar market exchange rates. 2020, 2021 and 2022 growth rates are forecasts. Forecasts are not a reliable indicator of future performance. Forecasts, projections and other forward-looking statements are based upon current beliefs and expectations. They are for illustrative purposes only and serve as an indication of what may occur. Given the inherent uncertainties and risks associated with forecasts, projections or other forward statements, actual events, results or performance may differ materially from those reflected or contemplated. Guide to the Markets – U.S. Data are as of June 30, 2021.
This lower valuation coincides with the international economies expanding and growing, just like in the US and China, but a bit delayed.
IN SUMMARY:
Our base case is that we have a very low recession risk for the next two years
We have a high correction risk, because of valuations and government policies, over the next twelve months.
We think that selective international companies are attractive. Financial regulation and easy money monetary policies are pushing the financial engines of our economy into private, non-public, opportunities previously only available to the ultra-wealthy. We are finding unique, idiosyncratic opportunities in non-public fixed income and equity funds.
Finally, and most importantly, there are a lot of ways to be foolish right now.
Our best advice is to stick with long-term, disciplined strategies that are focused on being “less wrong.”
For us, we love quality, dividend growth companies that are reasonably priced and have a runway to accomplish steady earnings growth. Our focus is on where their revenue is generated, not where their headquarters are located.
Key Takeaways:
- Base Case: Expect short-term volatility, lighten exposure in overvalued sectors
- Opportunities: European luxury, energy, quality dividend-paying companies
- Watch out for: Harmful regulation, virus surprise, global conflict
Sources:
¹ https://fas.org/sgp/crs/misc/IF10477.pdf
³ https://www.reuters.com/world/us/fed-expected-flag-start-monetary-policy-shift-debate-2021-06-16/
⁴ https://www.cnbc.com/2021/07/16/us-consumer-sentiment-drops-in-early-july-on-inflation-fears-.html
⁵ https://www.investopedia.com/terms/g/goldilockseconomy.asp A Goldilocks economy describes an ideal state for an economy whereby the economy is not expanding or contracting by too much. A Goldilocks economy has steady economic growth, preventing a recession, but not so much growth that inflation rises by too much