Download Our Latest Whitepaper HERE
“No man ever steps in the same river twice. For it’s not the same river and he’s not the same man.” – Heraclitus
Think of a river downstream from a dam release; when the water is released the river is filled with water and strong currents.
It will carry anything down river with ease. When the release is done, the depth of the water recedes, and obstacles appear. Kayakers be warned – danger exists.
Likewise, the Federal Reserve has released a “dam” of monetary stimulus over the last two years. This has changed the river and the man.
Our economy is no longer in need of stimulus and unfortunately, many investors are inexperienced kayakers in a river filled with rocks and other dangers.
After a year with extremely low volatility and strong markets we are left with very few opportunities that are reasonably priced. How is one to navigate safely? Where will the rocks appear and how do we prepare ourselves for some inevitable groundings

We’ll start our journey by sharing our map. We know our map is not accurate, but we’ll adapt as we navigate. We will discuss the rocks, eddies, and rapids that we think await, and conclude with where we think the journey will end.
Grab a paddle and seat cushion and let’s shove off!
During the first two weeks of the year, unemployment dropped below 4%, the Feds meeting minutes indicated a consensus that inflation was not transitory, and Russia amassed troops on the Ukraine border. This is symbolic of our expectations for the year.
- The chances of a recession are very low; aided by a healthy consumer, healing supply chains, a receding virus, and robust business investments.
- The Fed is serious about inflation. It will aggressively remove monetary stimulus
- Inflation will be the big story; our view is that it will come down substantially but remain above 3%.
- Geopolitical risk is higher than normal with Russian troops on the Ukrainian border and China playing nice until the Olympics.
- Finally, this will be an election year like no other. Every little bit of news will be subject to the political super spin. Half the country will be convinced that the end of western civilization will be upon us after their side looses in November. This creates market volatility as investors can’t see the economic forest because their vision is blocked by the trees of political spin.
1. THE VIRUS
The number of cases have spiked but hospitalizations have not. Unlike previous spikes, US consumers have not slowed their activity. Could this be Covid’s last hurrah? We hope so and that could be good news for the economy.
Bottom line, Covid might not be done with us, but we are done with Covid.
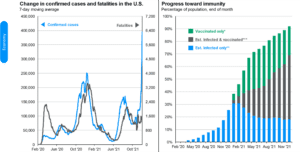
Source: Centers for Disease Control and Prevention, Johns Hopkins CSSE, Our World in Data, J.P. Morgan Asset Management. *Share of the total population that has received at least one vaccine dose. **Est. Infected only represents the number of people who may have been infected by COVID-19 by using the CDC’s estimate that 1 in 4.2 COVID-19 infections were reported. ***Est. Infected & vaccinated reflects those that have been both infected and vaccinated, assuming those infected equally likely to be vaccinated as those not infected. Guide to the Markets – U.S. Data are as of December 31, 2021.
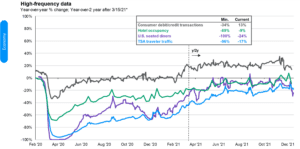
Source: Chase, OpenTable, STR, Transportation Security Administration (TSA), J.P. Morgan Asset Management. *Beginning 3/15/2021, all indicators compare 2021 to 2019. Prior to 3/15/2021, figures are year-over-year. Consumer debit/credit transactions, U.S. seated diners and TSA traveler traffic are 7-day moving averages. Consumer spending: This report uses rigorous security protocols for selected data sourced from Chase credit and debit card transactions to ensure all information is kept confidential and secure. All selected data are highly aggregated and all unique identifiable information—including names, account numbers, addresses, dates of birth and Social Security Numbers—is removed from the data before the report’s author receives it. Guide to the Markets – U.S. Data are as of December 31, 2021.
This slide below shows the consistency of our country’s Gross Domestic Product growth until it was interrupted by Covid.
We expect that our growth will overshoot the trend because of pent-up demand and the strength of the consumer
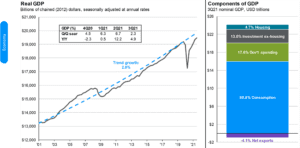
Source: BEA, FactSet, J.P. Morgan Asset Management. Values may not sum to 100% due to rounding. Trend growth is measured as the average annual growth rate from business cycle peak 1Q01 to business cycle peak 4Q19. Guide to the Markets – U.S. Data are as of December 31, 2021.
2. GOOD FOR WALL STREET, BAD FOR MAIN STREET
We often hear the rejoinder, “what is good for Wall Street is bad for Main Street”. It is understandable because so much of our corporate earnings growth has been the result of financial engineering. For example, companies borrow money at low interest rates and use the proceeds to buy back its own stock.
This type of earnings growth doesn’t trickle down to workers. Slide 4 shows that this time its different.
Workers are demanding (and getting) more flexible work arrangements, and higher wages. This is putting money in people’s pockets the old-fashioned way; they are earning it.
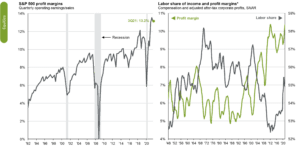
Source: BEA, Compustat, FactSet, Standard & Poor’s, J.P. Morgan Asset Management. Past performance is not indicative of future returns. *Labor share of income and profit margins are shown on a 4-quarter moving average basis. Guide to the Markets – U.S. Data are as of December 31, 2021.
3. DEMAND PULL INFLATION
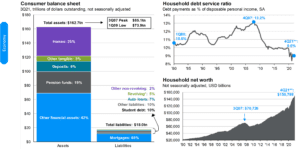
Source: BEA, Compustat, FactSet, Standard & Poor’s, J.P. Morgan Asset Management. Past performance is not indicative of future returns. *Labor share of income and profit margins are shown on a 4-quarter moving average basis. Guide to the Markets – U.S. Data are as of December 31, 2021.
Look at consumer balance sheets. I remember 15 years ago the US consumer had more debt than assets. It appears we learned a lesson from the great financial crisis. The US consumer has low debt and the amount they spend on debt service is near all time lows.
THE GREAT RESIGNATION!
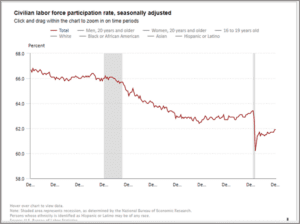 Also, with the strength of the real estate and stock markets net-worth is at the highest level in history ¹. Obviously, that is good news, but it has unintended consequences.
First, it is allowing people to drop out of the workforce but at the same time they want to buy more stuff with their money!
This is called demand pull inflation.
4. COST PUSH INFLATION
https://economictimes.indiatimes.com/nri/migrate/9-drop-in-h-1b-visa-holders-in-the-us-highest-in-a-decade/articleshow/88050668.cms?from=mdr
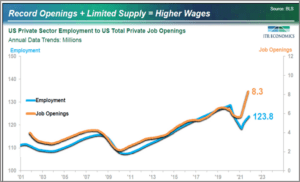
This slide tells the story clearly.
We are creating more jobs than we have people to fill them.
Baby boomers are retiring in record numbers, our immigration has tightened, HB1 work visas are at their lowest levels in a decade and work force participation isn’t rebounding. This is causing cost push inflation.
Remember your math! If something drops 50%, it must go up 100% to get back to even. We calculate inflation as a year-over-year phenomenon. As you can see, inflation dropped during Covid so the rebound was expected.
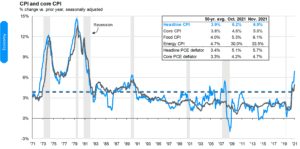
Source: BLS, FactSet, J.P. Morgan Asset Management. CPI used is CPI-U and values shown are % change vs. one year ago. Core CPI is defined as CPI excluding food and energy prices. The Personal Consumption Expenditure (PCE) deflator employs an evolving chain-weighted basket of consumer expenditures instead of the fixed-weight basket used in CPI calculations. Guide to the Markets – U.S. Data are as of December 31, 2021
5. OIL & OPEC
Take oil for example…
Oil prices were at $78.41 a barrel on October 3, 2018. Then dropped down to $11 a barrel on April 21, 2020. As of December 31, 2021, oil was priced at $76.21 a barrel – a huge percentage increase year-over-year, but not so substantial when your timeframe is elongated.
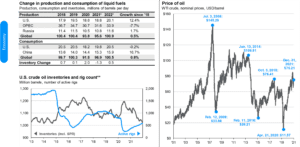
Source: J.P. Morgan Asset Management; (Top and bottom left) EIA; (Right) FactSet; (Bottom left) Baker Hughes.
*Forecasts are from the December 2021 EIA Short-Term Energy Outlook and start in 2021. **U.S. crude oil inventories include the Strategic Petroleum Reserve (SPR). Active rig count includes both natural gas and oil rigs. WTI crude prices are continuous contract NYM prices in USD. Guide to the Markets – U.S. Data are as of December 31, 2021.
Also note that the market is reacting. Rig count is increasing as US Frackers react to better prices and OPEC is increasing production.
6. INTEREST RATES
It is interesting to look back at interest rates.
Note that the Fed raised rates and then brought them back down in early 2020.
Then rates went to zero during the pandemic.
As we move on the Fed is returning us to more of a normal interest rate environment.
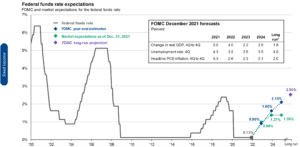
Source: Bloomberg, FactSet, Federal Reserve, J.P. Morgan Asset Management.
Market expectations are based off of the USD Overnight Index Forward Swap rates. *Long-run projections are the rates of growth, unemployment and inflation to which a policymaker expects the economy to converge over the next five to six years in absence of further shocks and under appropriate monetary policy. Forecasts are not a reliable indicator of future performance. Forecasts, projections and other forward-looking statements are based upon current beliefs and expectations. They are for illustrative purposes only and serve as an indication of what may occur. Given the inherent uncertainties and risks associated with forecasts, projections or other forward-looking statements, actual events, results or performance may differ materially from those reflected or contemplated. Guide to the Markets – U.S. Data are as of December 31, 2021
Fed Chair Powell promised to move rates above their long-term target of 2%. Interestingly the market doesn’t seem to believe him.
“If we see inflation persisting at high levels longer than expected, then if we have to raise interest more over time, we will,” Powell said. “We will use our tools to get inflation back.” – U.S. Federal Reserve Board Chairman Jerome Powell speaks during his re-nominations hearing of the Senate Banking, Housing and Urban Affairs Committee on Capitol Hill, in Washington, U.S., January 11, 2022. ²
7. QUANTITATIVE EASING
The other tool is quantitative easing via bond purchases in the open market
Basically, the Fed printed money and bought bonds in the open market creating an artificial demand thus increasing cost and lowering the yield.
By halting the purchase of bonds, you can expect rates to rise as demand shrinks.
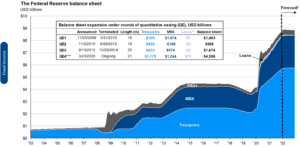
Source: FactSet, Federal Reserve, J.P. Morgan Investment Bank, J.P. Morgan Asset Management.
Currently, the balance sheet contains $5.7tn in Treasuries and $2.6tn in MBS. *The end balance sheet forecast assumes the Federal Reserve reduces the pace of purchases of Treasuries and MBS by $30bn per month, beginning January through mid-March, as suggested in the December 2021 FOMC meeting. **Loans include liquidity and credit extended through corporate credit facilities established in March 2020. Other includes primary, secondary and seasonal loans, repurchase agreements, foreign currency reserves and maiden lane securities. ***QE4 is ongoing and the expansion figures are as of the most recent Wednesday close as reported by the Federal Reserve. Forecasts are not a reliable indicator of future performance. Forecasts, projections and other forward-looking statements are based upon current beliefs and expectations. They are for illustrative purposes only and serve as an indication of what may occur. Given the inherent uncertainties and risks associated with forecasts, projections or other forward-looking statements, actual events, results or performance may differ materially from those reflected or contemplated. Guide to the Markets – U.S. Data are as of December 31, 2021
However, nothing is ever that simple. With higher rates, the global flow of capital should swing back to US bonds when compared to European or Japanese bonds.
With higher yields and a stronger dollar, rates might not increase as much as predicted because of the global flow of capital.
The good news is that with all of this change the markets are taking it in stride. Technical stuff like the yield curve and credit spreads are holding steady which reflects solid market sentiment.
Also encouraging is that even in an election year we don’t hear the politicians badgering the Fed about raising rates. Everyone seems to understand that inflation is a cancer, you don’t want even a little of it.
8. THE MARKET
The stock market is expensive in some areas and more reasonable in others.
This chart to the right shows the Price Earnings multiple of the market.
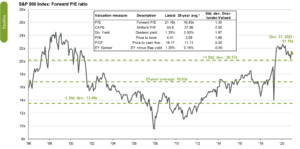
Source: FactSet, FRB, Robert Shiller, Refinitiv Datastream, Standard & Poor’s, Thomson Reuters, J.P. Morgan Asset Management. Price-to-earnings is price divided by consensus analyst estimates of earnings per share for the next 12 months as provided by IBES since December 1996, and J.P. Morgan Asset Management for December 31, 2021. Current next 12-months consensus earnings estimates are $228. Average P/E and standard deviations are calculated using 25 years of IBES history. Shiller’s P/E uses trailing 10-years of inflation-adjusted earnings as reported by companies. Dividend yield is calculated as the next 12-months consensus dividend divided by most recent price. Price-to-book ratio is the price divided by book value per share. Price-to-cash flow is price divided by NTM cash flow. EY minus Baa yield is the forward earnings yield (consensus analyst estimates of EPS over the next 12 months divided by price) minus the Moody’s Baa seasoned corporate bond yield. Std. dev. over-/under-valued is calculated using the average and standard deviation over 25 years for each measure. *P/CF is a 20-year average due to cash flow availability. Guide to the Markets – U.S. Data are as of December 31, 2021
Basically, it is a measure of how expensive a company is when compared to its earnings.
Even after the market returning 27% last year the market is actually cheaper because corporate earnings grew faster than stock prices.
9. THE RIVER BEND
What’s around the river bend?
There are a lot of tributaries on the stock market river. There are small cap vs. large cap, domestic vs. international and growth vs. value.
OUR BASE CASE: As the US and World economies continue to recover, we don’t want to over or underweight international vs. domestic. Because of the “onshoring” movement, i.e. manufacturing moving back to the US, we don’t want to change our allocation to small caps.
Small cap stocks include a lot of domestic manufacturers and suppliers. The one area of opportunity is growth vs. value.
Growth analysts focus on a company’s earnings growth while value managers focus on things like corporate assets. Analysts that focus on growth companies tend to buy technology, health care, and companies that offer fast earnings growth.
Growth stocks performance has trounced value stocks.
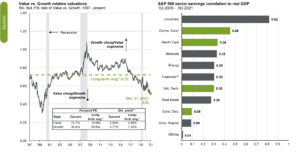
Source: FactSet, FTSE Russell, NBER, J.P. Morgan Asset Management.(Left) Growth is represented by the Russell 1000 Growth Index and Value is represented by the Russell 1000 Value Index. *Long-term averages are calculated monthly since December 1997. **Dividend yield is calculated as the next 12-month consensus dividend divided by most recent price. (Right) *Communication services correlation is since 3Q13 and based on backtested data by JPMAM. **Financials correlation is since 4Q19.Guide to the Markets – U.S. Data are as of December 31, 2021.
As you can see value stocks haven’t been this inexpensive compared to growth stocks since the infamous “tech wreck” of 2000.
This has created a strange “index concentration effect” where a large percentage of the S& P500 is concentrated in a few large cap names like Apple, Microsoft, Apple, Amazon and Tesla.
In fact, they account for 30% of the index and 25.8% of the earnings. They are trading at a multiple of 33.2 x earnings vs. the remainder of the index at 19.7.
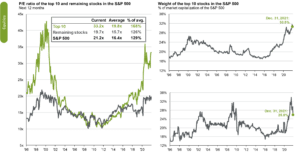
Source: FactSet, Standard & Poor’s, J.P. Morgan Asset Management. The top 10 S&P 500 companies are based on the 10 largest index constituents at the beginning of each month. The weight of each of these companies is revised monthly. As of 12/1/2021, the top 10 companies in the index were AAPL(6.8%), MSFT (6.5%), AMZN (3.9%), TSLA (2.3%), GOOGL (2.2%), GOOG (2.1%), NVDA(2.1%), FB (1.9%), BRK.B (1.3%), JPM (1.2%), and JNJ (1.2%). The remaining stocks represent the rest of the 494 companies in the S&P 500. Guide to the Markets – U.S. Data are as of December 31, 2021.
Indexing can be a self-fulfilling prophecy where the more people invest in the index the more exaggerated these trends become. This will take some time to unravel.
Our strategy is to lean toward value stocks in the first half of the year.
10. ELECTION YEAR.
It is important to remember that 2022 is an election year.
Our observation is that America is strongly divided into a red team and a blue team. Many team members not only think their team is right, but they also believe the other team is stupid, evil and “Un-American.”
As one team gains political momentum the press and the political spin masters will paint their victory as the end of western civilization. We think this could create a lot of stock market volatility.
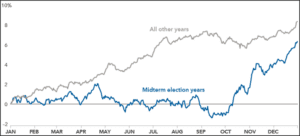
Because the market tends to go up, the annualized graph of market returns is not a surprise, but if you isolate the midterm election years, you’ll note the market oscillates until after the election.
OUR VIEW
 Our map for the 2022 journey.
As we begin our 2022 journey, we will want to raise cash and trim excessively priced companies. Over the next 3 to 5 years, we expect inflation to moderate and great growth companies to return to dominance. We are looking for opportunities to accumulate these great companies at reasonable prices.
We believe that bonds will remain weak but are necessary ballasts to our canoes. There is heightened geopolitical risk.
Finally, there is an investor risk. Many investors have never navigated a river with rapids and rocks. I believe the canoes and kayaks founded on flimsy substances like crypto currency, digital tokens and “meme” stocks could capsize and eliminate a lot of wealth.
Don’t underestimate the impact of wealth elimination on our economy. These necessary corrections happen every decade or two.
OUR ADVICE: Make sure the canoes are stable, slow down and watch for obstacles. Our journey is not a race.
FROM THE DESK OF
SCOTT PINKERTON, CFP®, CIMA®, CPWA®, Partner, Planner
IMPORTANT DISCLSOURES:
FourThought Financial, LLC (FFLLC) is an SEC-registered investment advisor. For information pertaining to FFLLC please contact FourThought Private Wealth or refer to the SEC’s website, www.adviserinfo.sec.gov. This presentation is provided for informational purposes, not as personal investment advice. This presentation may contain certain forward-looking statements which indicate future possibilities. Any hypothetical example is intended for illustrative purposes only and does not represent an actual client or an actual client’s experience, but rather is meant to provide an example of the process and the methodology. Any reference to a market index is included for illustrative purposes. It should not be assumed that your account performance will correspond directly to any benchmark index. There is no guarantee views and opinions expressed herein will come to pass. Past performance is no guarantee of future results.

