Imagine that you live in a village a long time ago
where you work together to farm and make things to help the community survive and thrive. Unfortunately, outside the village there are some very bad “wolves” that can attack and wreak havoc. There are guards placed along the perimeters of the village. Their job is to alert the village of an impending wolf attack. The challenge is that when the wolf alert is sounded, the entire village must be taken offline to protect the inhabitants. Herein lies the tension: if you take the village offline too often, no work gets done and the villagers suffer.
This simple analogy applies to our challenges as portfolio managers. As guardians of clients’ portfolios, we need to be very watchful of potential danger; however, to overreact can also have serious consequences. Remember, there are always wolves and history has taught us that the costliest attacks happen when you least expect them. Thus, we want to wait until we see the “whites of the wolf’s eyes” before taking aggressive action.
In Scott Pinkerton’s 32 years (33 years in October) as an investment professional, he has developed several axioms to help our firm make decisions about markets. It is worth knowing that none of these are 100 percent effective and that everything must be adjusted to factor differences like inflation and interest rates. Some of our axioms are:
1.Valuations matter.
2.Pay attention to the health of the economy.
3.Debt cycles are dangerous.
4.Government fiscal and monetary policy are critical. Don’t fight the Fed.
5.The trend is your friend.
In this paper we will discuss potential “wolves.” Then we will discuss the opportunities and the playbook we have developed to help you survive and thrive during this period of uncertainty. (To download the full text as a pdf please click: Q4 2020 Economic Commentary)
Overpriced Valuations
The first thing that strikes you about the graph here is the volatility of the markets in 2020. We experienced a 34% decline and then a 50% recovery. Breathtaking!
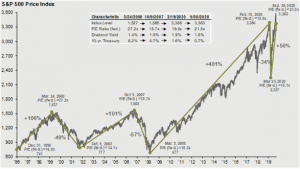
Source: FactSet, NBER, Robert Shiller, J.P. Morgan Asset Management. Data shown in log scale to best illustrate long-term index patterns. Past performance is not indicative of future returns. Chart is for illustrative purposes only. Guide to the Markets – U.S. Data are as of September 30, 2020.
Some important takeaways are that the valua-tion of the market, based on forward P/E ratios is 21.5%. That is high, and clearly the market is expensive. Note as well that the dividend and 10-year Treasury yields are at two-decade lows. That being said, we must always be aware of pattern recognition bias, which is the desire to recognize patterns when we do not have enough data.
Decreased Consumer Spending
Bob Woodward’s book “The Choice,” about how Bill Clinton defeated George H.W. Bush, contains Clinton’s famous self-reminder, “It’s the economy stupid.” When Clinton was on the campaign trail he would remind himself to keep his message on the economy. Likewise, when you think of the US economy, it is important to remember that our economy is driven by the consumer. Sixty-seven percent of our economy is related to consumer consumption. Our GDP had a dramatic drop because consumers stopped consuming. Con- sumption, when it returns, will bring along its beautiful cousin, optimism. This could be a powerful catalyst.
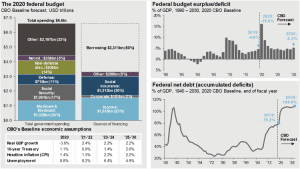
Source: CBO, J.P. Morgan Asset Management; (Top and bottom right) BEA, Treasury Department. 2020 Federal Budget is based on the Congressional Budget Office (CBO) September 2020 Baseline Budget Forecast. CBO Baseline economic assumptions are based on the Congressional Budget Office (CBO) July 2020 Update to Economic Outlook. Guide to the Markets – U.S. Data are as of September 30, 2020.
Rising Consumer Debt
For most of my career American consumers have had “debt up to their eyeballs.” Not anymore. Ever since the global financial crisis, individual American balance sheets have been in good shape. Household debt service is at multi-decade lows and net worth is at multi-decade highs. Many of our previous financial crises were triggered by consumer debt. This wolf seems to be caged for the time being.
The Fed’s Unbalanced Balance Sheet
Remember we have two liability ledgers in America today: our traditional budget deficit and the Fed’s balance sheet generated by quantitative easing. Before 2007 our Fed never deployed this tool. Then the Fed printed money to buy government bonds. This eliminated much of the discipline of what Clinton called “the bond
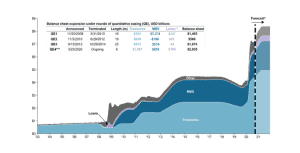
Source: FactSet, Federal Reserve, J.P. Morgan Investment Bank, J.P. Morgan Asset Management. Currently, the balance sheet contains $4.4 trillion in Treasuries and $2.0 trillion in MBS. The end balance forecast is $5.4 trillion in Treasuries and $2.5 trillion in MBS by December 2021. Guide to the Markets – U.S. Data are as of September 30, 2020.
market vigilantes.” Clinton was frustrated by the discipline of the markets. If an economy became leveraged, the bond market would require a higher yield to compensate for the higher risk. No more. The Fed can now step in and provide limitless demand for bonds and select financial products. That is, until it can’t. At some point there will be a straw that breaks this camel’s back, but it seems that the camel of the U.S. economy can shoulder a lot more debt straw.
Deflation
Have you ever heard the saying “The problem with generals is they fight the last war?” This is a psychological truth called recency bias. We tend to focus on our last problem and not necessarily on our current problem. Our Fed is not focused on or concerned about inflation; it is concerned about deflation—something we haven’t seen since the 1930s. The problem we face is that the conventional wisdom of “what worked then will work now.” But it isn’t, and it hasn’t worked for Japan over the last three decades. Do we have an answer for deflation?
The Overall Debt Picture
We like this chart because it provides a sense of proportion. Note that as our 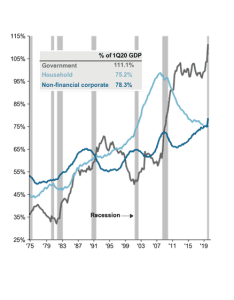 consumer debt has shrunk, our government debt has stepped in to fill the void. We are warning clients to avoid bond indexes because, as you can see, the duration risk is rising as it the credit risk.
Flat Yield Curve and Tina
The yield curve is a simple, elegant, and effective predictor of economic strength. It measures the demand for U.S. bonds along the duration curve. Remember that interest rates are set by simple supply and
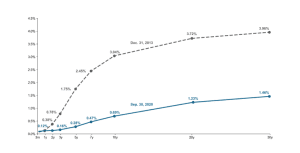
Source: FactSet, Federal Reserve, J.P. Morgan Asset Management. Guide to the Markets – U.S. Data are as of September 30, 2020.
demand. When the curve is sloped it means that bond investors demand a higher yield for longer term bonds. This was the case in 2013. Today the yield curve is flat, indicating that the yield on the 2-year bond is close to the 10-year bond. This means that investors are willing to lock up their money longer and accept lower yields. This only happens when they are predicting slow growth.
There are two things to consider: 1) What is the impact of quantitative easing to the curve and the relativity of the yields, and 2) If stocks are overvalued, what alternatives do you have?
Consider TINA, an acronym that stands for “There is no Alternative.” This is the tension investors are facing. You need your money to make money. Stocks might be expensive, but are the options when yields are low? You can’t so much as break even investing in these “safe” investments after taxes and inflation.
The Coronavirus
We cannot talk about the economy without talking about the coronavirus. Our economy has been buoyed by home building. With low interest rates, Americans are building. They are not traveling or dining out. This is unsu
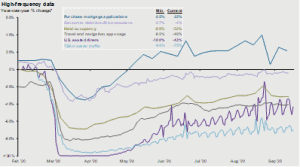
Source: App Annie, Chase, Mortgage Bankers Association (MBA), OpenTable, STR, Transportation Security Administration (TSA), J.P. Morgan Asset Management. Guide to the Markets – U.S. Data are as of September 30, 2020.
stainable. Hopefully, with vaccines and treatment progress we will see a more balanced recovery. Expect the leadership within the stock market to change. We expect industrial and consumer discretionary companies to revive.
The Presidential Election
We had some debate about whether to include this slide. We concluded that it is a wolf whistle. We do not think we have enough data to come to any meaningful conclusions. But, to state
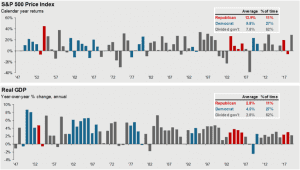
Source: FactSet, Office of the President, J.P. Morgan Asset Management; (Top) Standard & Poor’s; (Bottom) Bureau of Economic Analysis. Top chart shows S&P 500 price returns. Guide to the Markets – U.S. Data are as of September 30, 2020.
the obvious, our economy is increasingly linked to government policy. The amount of regulation and taxation impacts our growth. Our growth impacts our tax receipts. Our tax receipts will determine if our debt is manageable (GDP growth at 2-3%) or becomes a problem (lower growth). Remember what Clinton said: “It’s the economy stupid.”
Playbook for Guarding Against Wolves…And Seeing Opportunity.
Maintain Perspective Through the Lens of History
First, remember we are in the middle of a contentious election. This is the time when the masters of media stoke and poke at our differences and vilify “the others.” This graph is important because it provides perspective. It is a logarithmic graph that shows we have plenty of room to grow and we are not necessarily extended. The world will not end if the other side is elected.
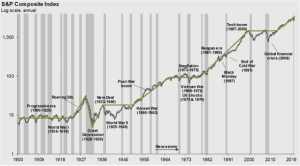
Source: FactSet, NBER, Robert Shiller, J.P. Morgan Asset Management. Data shown in log scale to best illustrate long-term index patterns. Past performance is not indicative of future returns. Chart is for illustrative purposes only. Guide to the Markets – U.S. Data are as of September 30, 2020.
Avoid Concentration Risk
Some people view the S&P 500 is a scientific representation of the U.S. economy. It is not. Rather, it is a group of companies selected by a committee within a company (Standard and Poor’s). They weight the index based on market capitalization. Market capitalization is calculated by taking the total number of shares of a company and multiplying it by the price per share.
Note that it isn’t measuring earnings, sales or anything that actually measures the true size and impact a company has.
It is a popularity contest. Today the popularity of the five largest market cap companies (Apple, Google, FaceBook, Microsoft and Amazon) is oversized compared to history. We believe this is a tradable opportunity. As the economy recovers, and the recovery diversifies to include other industries besides tech, the benchmark indexes will be forced to rebalance. This could create a nice draft stream for the smaller constituents of the indexes. Therefore, we will be adding “equal weight” indexes to many of our strategies and adding companies that have been out of favor.
Watch Covid Part II
For various reasons, Southeast Asia has contained the virus better than other parts of the world. Their consumers should have more strength than most coming out of the pandemic. That is why we are aggressively looking for companies with strong business presences in these markets (but not in China, where we can’t trust the accounting).
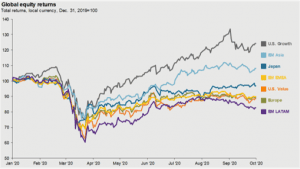
Think Internationally
The slide here speaks for itself. Note how U.S. growth stocks have performed compared to U.S. value and other areas.
We believe in American Exceptionalism. But we also believe there are exceptional companies all over the world, and this slide shows why. Many of these are cheaper than their U.S. counterparts and therefore carry less investment risk. We are on the hunt to find them.
Scott Pinkerton says he spends about half of his reading time on the economy and modern behavioral finance issues, and the other half reading the ancients. He has remarked at the strong connection between the two–how we get caught up in the news of today and loose sight of the fundamental truths that have governed civilization.
No one can predict the future. We have a lot of pride in our ability to understand the data and to pontificate its meaning, but we must not fool ourselves: we don’t know what the future holds.
There are things that are happening that we have never seen before, but that doesn’t mean things will end badly. Don’t overreact. Please know that we will not be able to predict the next crash or boom cycle. We must diligently stand guard, name and identify threats and listen for the threats we can’t see. In the meantime, we’ll keep your money working.
Source: FactSet, FTSE Russell, MSCI, J.P. Morgan Asset Management. Growth is represented by the Russell 1000 Growth Index and Value is represented by the Russell 1000 Value Index. Guide to the Markets – U.S. Data are as of September 30, 2020.