Stay on Target – Beware of the Biases
(To download a printable pdf of this white paper, click HERE).
You remember the climax of the first Star Wars movie…
 Luke Skywalker is in his X Fighter, zooming on to a runway with the target that, if hit, will destroy the Death Star. The Chant – “Stay on Target”- “Stay on Target”– repeats in the pilot’s headgear. There is incredible turbulence as fighter after fighter gets picked off until finally, Skywalker hits the target, and the universe is saved.
This is an apt metaphor for investing today. There is a lot of data and punditry that infiltrates our headgear. It is important to “stay on target.”
Our subtitle is “beware of our biases.”
Don’t get hung up on the word “bias.” From an investment perspective, everyone has biases. Successful investing requires us to recognize our biases and counter- balance them.
Some predominant biases today are “recency” bias (what we remember recently takes on more importance), confirmation bias (looking for information that supports your position), and pattern recognition bias.
Targets can shift or be moved. It is hard to know how to separate the news from the noise.
In this paper we will focus on those tensions and share how we think about them considering our biases and what we are doing now in our portfolios and recommended allocations.
1. THE TURBULENCE
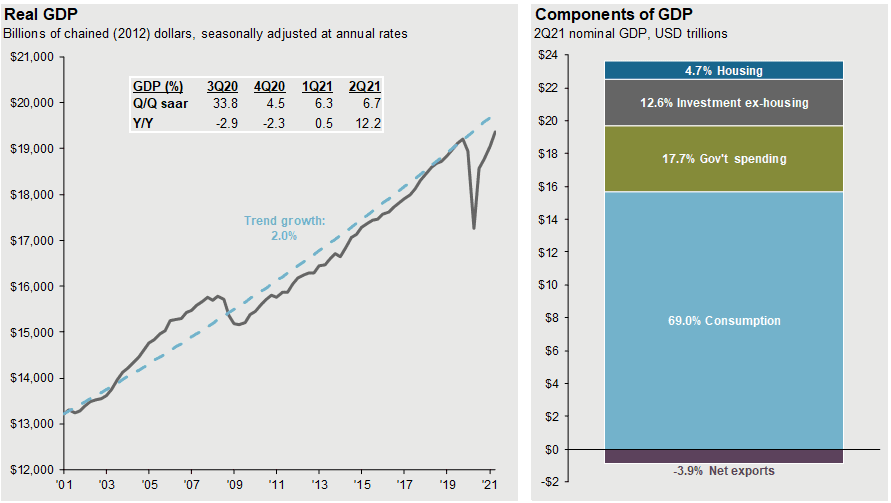
Source: BEA, FactSet, J.P. Morgan Asset Management. Values may not sum to 100% due to rounding. Trend growth is measured as the average annual growth rate from business cycle peak 1Q01 to business cycle peak 4Q19. Guide to the Markets – U.S. Data are as of September 30, 2021.
The Turbulence – we are moving too fast – the market is ahead of itself and overvalued
This chart is alarming. From 1996-2008 we see a long pattern where the market advanced, retracted, then advanced again and retracted again.
Next, the market climbs dramatically and then recently accelerate above its trend line.
There is a lot of apprehension about the market. Based on traditional measures (P/E multiples for example) the market is expensive. It is running ahead of its trend line. This makes us nervous, but we are also mindful of our pattern recognition bias.
2. THE TURBULENCE: VALUATIONS REVERTING TO THE MEAN
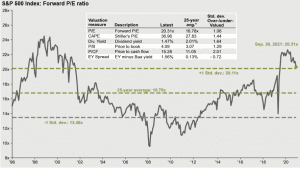
Source: FactSet, FRB, Robert Shiller, Standard & Poor’s, Thomson Reuters, J.P. Morgan Asset Management. Price-to-earnings is price divided by consensus analyst estimates of earnings per share for the next 12 months as provided by IBES since September 1996, and J.P. Morgan Asset Management for September 30, 2021. Current next 12-months consensus earnings estimates are $214. Average P/E and standard deviations are calculated using 25 years of IBES history. Shiller’s P/E uses trailing 10-years of inflation-adjusted earnings as reported by companies. Dividend yield is calculated as the next 12-months consensus dividend divided by most recent price. Price-to-book ratio is the price divided by book value per share. Price-to-cash flow is price divided by NTM cash flow. EY minus Baa yield is the forward earnings yield (consensus analyst estimates of EPS over the next 12 months divided by price) minus the Moody’s Baa seasoned corporate bond yield. Std. dev. over-/under-valued is calculated using the average and standard deviation over 25 years for each measure. *P/CF is a 20-year average due to cash flow availability. Guide to the Markets – U.S. Data are as of September 30, 2021.
This graph tracks the price to earnings ratio of the market.
Interestingly, the valuation of the market has actually gone down this year.
But it is still expensive relative to its history. A contrarian would argue the fact that inflation is well below its 25-year history, and therefore justifies a higher premium
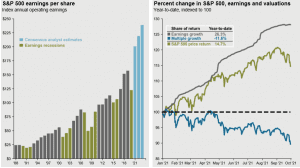
Source: FactSet, Compustat, Standard & Poor’s, J.P. Morgan Asset Management. Historical EPS levels are based on annual operating earnings per share. Earnings estimates are based on estimates from Standard & Poor’s and FactSet Market Aggregates. Past performance is not indicative of future returns. Guide to the Markets – U.S. Data are as of September 30, 2021.
Earnings growth to the rescue.
Earnings have been robust- growing at 26.3% so far this year, far outpacing the 14.7% return of the stock market.
That means that even though the market has gone up, its valuation has gotten cheaper.
3. FORECAST, NOT PREDICT
Let’s pause for a moment to “Stay on Target”
The foundation of our successful wealth management approach is to consistently recognize that we are not “gods,” and we can’t predict the future. The human race is drawn to people who sound highly intelligent and have confident predictions about what will happen. Listening to such punditry can be damaging to your financial future. Trying to predict what is going to happen is a fool’s errand and can lead you to fail at your financial goals.
A better approach is to forecast and not predict

With a forecast, we develop a base case that we think is most likely. Then we identify the positive and negative impacts that could influence the direction of the economy and markets.
Some of the major sources of turbulence for the next 18 months will be covid, labor costs, supply chains and China.
The long-term target is supported by a return to globalization, productivity enhancements, and the relative attractiveness of U.S. stocks to other economies and alternatives. We see the chance of a correction (defined as a 15% decline in the major U.S. averages) of around 20-30% in the next 12 months. Our base case is that labor costs and supply chains will be fixed relatively soon and the world’s long-term view on China is changing.
We continue to favor a low allocation of bonds relative to the historic norms. We balance this risk by focusing on quality, dividend growth companies to lower the risk of traditional stock investing. We are also lowering our international allocation in favor of small cap U.S. growth companies.
“Our target” is an economy driven by productivity enhanced technological improvements arising from the increased use of Machine Learning and Artificial Intelligence. The move towards sustainable energy is investable. When thinking about our international allocation we think more about revenue than real estate. Meaning, we want companies who are disrupting industries with new technologies and approaches, regardless of whether their headquarters are in Toledo or Tokyo
Our base case is for continued growth in earnings and an economy that returns to a slow growth trend. This will ultimately benefit global companies who are best able to grow their earnings consistently regardless of the economic turbulence.
4. TURBULENCE VS. TARGET
Let’s examine more closely the “Turbulence vs. Target” that we are facing today.
Inflation has popped. Remember this is a year over year comparison. Oil prices are surging when compared to 2020 when Covid crushed the economy and traveling.
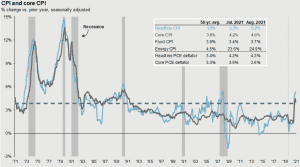
Source: BLS, FactSet, J.P. Morgan Asset Management.CPI used is CPI-U and values shown are % change vs. one year ago. Core CPI is defined as CPI excluding food and energy prices. The Personal Consumption Expenditure (PCE) deflator employs an evolving chain-weighted basket of consumer expenditures instead of the fixed-weight basket used in CPI calculations. Guide to the Markets – U.S. Data are as of September 30, 2021.
With the economic comeback, oil prices have picked up. Most economists, including the Federal Reserve, think this will be transitory. Meaning this is a bumpy number that will revert to a 2% level as the economy returns to normal
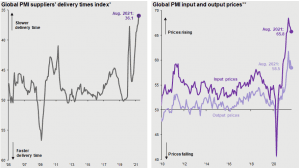
Source: IHS Markit, J.P. Morgan Asset Management. *Participants in IHS Markit’s PMI business surveys, conducted in 44 countries, are asked: “Are your suppliers’ delivery times slower, faster or unchanged on average than one month ago?“. Index includes the manufacturing and construction sectors. A reading of 50 = no change, >50 = faster delivery time, <50 = slower delivery time.**Participants are asked: “Are input/output prices the same, higher or lower?”. Values shown reflect the composite index which includes both manufacturing and services. A reading of 50 = no change, >50 = price increase, <50= price decrease. Guide to the Markets – U.S. Data are as of September 30, 2021.
Another “cost push” with inflation is the supply chains.
We are unable to get some of the products we want because of shipping problems and international production shut-downs due to the resurgent Covid cases.
Hundreds of ships filled with products are dead in the water, unable to unload their goods due to a myriad of reasons including a lack of truckers and surging demand.
As the graphs to the right illustrates the cost and time of shipping has exploded.
5. INTERESTING OBSERVATIONS ON WEALTH
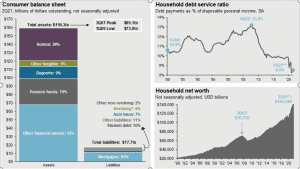
Source: FactSet, FRB, J.P. Morgan Asset Management; (Top and bottom right) BEA. Data include households and nonprofit organizations. SA – seasonally adjusted. *Revolving includes credit cards. Values may not sum to 100% due to rounding. **3Q21 figures for debt service ratio and household net worth are J.P. Morgan Asset Management estimates. Guide to the Markets – U.S. Data are as of September 30, 2021.
There are so many economic statistics that regardless of what they say, will be spun negatively. Take for example the information packed in these graphs.
For decades we’ve been watching the American consumers balance sheet. We remember how for decades the American consumer was “underwater” meaning that they had more liabilities than assets.
On the left, you can see that the state of the American consumer is radically improved. Note the household debt service ratio- which is the reflection of low interest rates and lower overall debt levels- is substantially lower than anytime in history.
Finally, the lower right shows household net worth is at an all time high; reflecting record stock and real estate prices.

These factors are contributing to what we call “the great resignation.”
A large number of Americans are choosing not to work. They are dropping out of the work force.
6. LABOR COST
The Turbulence. Inflation. Cost-Push, Labor Costs.
Labor cost is a major source of turbulence.
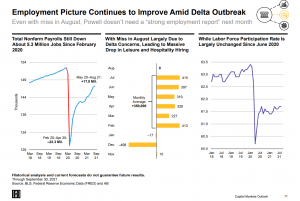
Historical analysis and current forecasts do not guarantee future results. Through September 30, 2021 Source: BLS, Federal Reserve Economic Data (FRED) and AB. Source: Alliance Bernstein, Captial Markets Outlook, 4th Quarter 2021
Our employment picture was getting brighter every month until August. We were adding around 350,000 new jobs a month and our non-farm payrolls were recovering smartly.
Economists attributed the weak numbers in August to the resurgent Covid numbers.
We noticed that over 100,000 educators resigned when school resumed. Note the workforce participation on the right side of the graph. We had over 4 million people have drop out of the workforce since 2020.
Our thoughts are that not all of them will return and they are dropping out at a rate faster than the birth rates and immigration numbers can offset.
6. PROFIT MARGIN
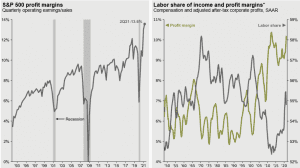
Source: BEA, Compustat, FactSet, Standard & Poor’s, J.P. Morgan Asset Management. Past performance is not indicative of future returns. *Labor share of income and profit margins are shown on a 4-quarter moving average basis. Guide to the Markets – U.S. Data are as of September 30, 2021
This is leading to the double- edged sword of higher wages.
As you can see, US profit margins have surged as the economy recovered and that since 2015 labor has been increasing.
That’s the good news. Higher wages lead to a better standard of living if productivity keeps pace and inflation is under control.
8. TURBULENCE: OUR GOVERNMENT DEBT
Currently our debt to GDP stands around 106% (see bottom right). This is an historic, non-wartime high which is alarming.

Source: CBO, J.P. Morgan Asset Management; (Top and bottom right) BEA, Treasury Department. Estimates are based on the Congressional Budget Office (CBO) July 2021 Update to the Budget and Economic Outlook, except for 2021 estimates of the federal deficit and net debt levels. These estimates and the details on the breakdown of spending, excluding net interest, are J.P. Morgan Asset Management estimates. Other spending includes, but is not limited to, health insurance subsidies, income security and federal civilian and military retirement. Note: Years shown are fiscal years. Forecasts are not a reliable indicator of future performance. Forecasts, projections and other forward-looking statements are based upon current beliefs and expectations. They are for illustrative purposes only and serve as an indication of what may occur. Given the inherent uncertainties and risks associated with forecasts, projections or other forward-looking statements, actual events, results or performance may differ materially from those reflected or contemplated. Guide to the Markets – U.S. Data are as of September 30, 2021.
The last two years of stimulus packages spiked our deficits but those will abate and return to the longer- term trend.
The current spending package being debated in Congress comes with tax increases, so the Congressional Budget Office expects the deficit trend line to flatten out. Other countries like China (if you include all the government debt) is estimated to be 335%² and Japan is 266%. ³
Japan has been in a deflationary spiral that we believe to be the result of regulatory pressures (industry protection for example) and not a monetary phenomenon. Our debt is very high compared to most other countries however, Germany⁴ is around 70% and Britain⁵ is around 90%.
As we all know, some things don’t matter until they matter. This feels like one of those things to us. If other parties stop buying our bonds and yields go up, the cost of all this government borrowing will go up. Unfortunately, there doesn’t seem to be a big appetite for less government spending.
9. PRODUCTIVITY ENHANCEMENTS
“We always overestimate the change that will occur in the next two years, and we underestimate the change that will occur in the next ten years.” – Bill Gates

Productivity enhancements are everywhere. People are getting more done in less time.
For example, I am typing this in the Delta Lounge on my iPad. As I type Microsoft word gives me suggestions to finish my thoughts. I would guesstimate it is around 50% accurate. This increases my speed and reduces my punctuation and spelling errors.
Julie and I are flying home from visiting our daughter and son-in-law who is a lawyer. He shared how technology has changed the way lawyers research cases and case law. He is still working 24/7 as an associate but the rewards are in the interpretation of the data and not the finding.
We can’t think of an industry that is not going to be changed by Machine Learning and AI (Artificial Intelligence).
10. STAY ON TARGET: LONG-TERM TRENDS
Our base case is based on the graph below.
Source: BEA, FactSet, J.P. Morgan Asset Management. Values may not sum to 100% due to rounding. Trend growth is measured as the average annual growth rate from business cycle peak 1Q01 to business cycle peak 4Q19. Guide to the Markets – U.S. Data are as of September 30, 2021.
Until proven otherwise, we will bet on long-term trends continuing.
An axiom at our shop is “the spoon will outlast the iPhone.” Meaning, we are confident that in 100 years we will still be using spoons but doubt we will be using iPhones.
Long term GDP has averaged 2%, right around the Fed’s long term inflation target. As the graph above illustrates, our GDP shrank during Covid and is getting back to normal.
When it does, we expect the long-term trend of slow GDP growth to reemerge. This will favor companies that can consistently grow above that trend line.
We plan on using weakness in the markets and in individual great companies to accumulate positions for the long term.
11. SHORT TERM CONCERNS AND VOLATILITY
Stay on Target. Live with and use volatility.
Don’t let short- term concerns and volatility get in the way of your long- term objectives.
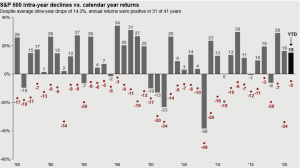
Source: FactSet, Standard & Poor’s, J.P. Morgan Asset Management. Returns are based on price index only and do not include dividends. Intra-year drops refers to the largest market drops from a peak to a trough during the year. For illustrative purposes only. Returns shown are calendar year returns from 1980 to 2020, over which time period the average annual return was 9.0%. Guide to the Markets – U.S. Data are as of September 30, 2021.
The point of the graph to the left is that corrections and volatility are normal and should be expected.
This simple bar graph shows the return of the market annually since 1980. The red dot shows the amount the market was down during that year.
For example, in 2020, the market returned 16% for the year but at the height of the Covid pandemic it had dropped 34%. When does a correction turn into a crash? Historically, there have been a combination of high consumer debt, an economy that is recessing and an exogenous event occurring simultaneously and unpredictably that tip a correction into a crash.
A second example, in 1929 the exogenous event was margin calls, in 2000 it was 9-11 and fraudsters like Enron and MCI World Com, 2008 was credit default swaps and last year was Covid. These events are unpredictable but a part of our history. That is why portfolio diversification, investing to generate cash flow, and understanding our inability to predict are so important.
12. STAY ON TARGET – LOW INFLATION
Stay on Target. Low real interest rates. Continued…
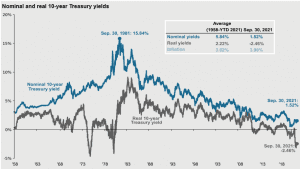
Source: BLS, FactSet, Federal Reserve, J.P. Morgan Asset Management. Real 10-year Treasury yields are calculated as the daily Treasury yield less year-over-year core CPI inflation for that month except for September and August 2021 where real yields are calculated by subtracting out September 2021 year-over-year core inflation. Guide to the Markets – U.S. Data are as of September 30, 2021.
There is a single fact that is underpinning the real estate and stock markets- low interest rates.
Low interest rates make homes more affordable. Low interest rates make development projects more profitable. Low interest rates lower the attractiveness of interest-bearing assets like bonds and CD’s and therefore, make stocks more attractive.
Interest rates are currently low. They have risen a bit, but on real and a nominal basis; they are low. This is good for the economy and markets.
13. INTEREST RATES
Interest rates are low now but are rising.
After hitting a pandemic low of .63% the 10-year Treasury has increased to 1.57%.
Here is an interesting study of the correlation of interest rate movements and stock prices. When you see a strong correlation, that means that stock prices and treasury yield move together.
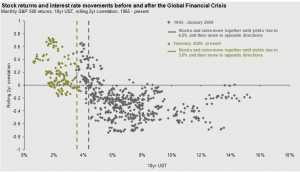
Source: FactSet, J.P. Morgan Asset Management. X-intercept for each data set is calculated using a quadratic regression where interest rates are the independent variable, and the rolling 2-year correlation of stock returns and interest rate movements is the dependent variable. Guide to the Markets – U.S. Data are as of September 30, 2021.
What this tells us is that stock prices have tended to go up since 2008 if rates go up but, are under 3.6%.
Bottom line; our economy can handle higher rates put to a point.
14. CHINA
There are two schools of thought pertaining to China.
One looks at the actions and declarations of the Chinese Communist Party (CCP) since 2015 and the constant movement away from free markets and global trade. Just this year they have cracked down on video games, big Chinese tech, online education companies, and social media companies.
U.S. regulators are moving towards forcing Chinese companies listed on American exchanges to abide by U.S. accounting rules. This camp sees these trends resulting in China retreating from the global trade stage.
The other side views the Chinese as rational actors who recognize their need for innovation and outside investment and management.
The movement towards Global Trade initiated under Deng Xiopeng successfully allowed millions of Chinese workers to migrate from farms to cities.
China, in their view, must continue to grow to support these underlying factors and therefore will participate in the global markets.
OUR VIEW
Our view is that China sees our system as a failure and that America is in decline. Their increased wealth has not led to personal freedom and democracy.
One must be aware of the possibility of government interference when investing in China. We believe that this will limit the growth and values of companies dependent on the Chinese markets. This is balanced by the size and growth opportunity that China represents.
IN SUMMARY
Stay on Target
You need to steel yourself for a potential correction. It could happen. You want to be prepared without trying to “time” it. This means, make sure you have the cash flow and the liquidity to survive and thrive.
You also must have the mental fortitude to take advantage of opportunities. We believe the long-term growth opportunity that AI and Machine Learning represents will drive equity returns for the next decade.
Sources:
1https://www.cnn.com/2021/05/20/investing/inflation-stocks-economy-federal-reserve/index.html
3https://tradingeconomics.com/country-list/government-debt-to-gdp